Google Analytics 4 (32)
 Facebook Ads (4)
 Google Ads (8)
 HubSpot Marketing (26)
 HubSpot CRM (12)
 Google Search Console (7)
 Vimeo OTT (1)
 StackAdapt (2)
 SEMrush (8)
 Mixpanel (2)
 Adobe Analytics (1)
 Mailchimp (1)
 Marketo (1)
 Ahrefs (1)
 Facebook Pages (4)
 Shopify (2)
 LinkedIn Company Pages (3)
 X (Twitter) (3)
 Wistia (1)
 Moz (1)
 WooCommerce (1)
 Instagram Business (2)
 Stripe (1)
 Google AdSense (1)
 LinkedIn Ads (1)
 ProfitWell (1)
 Google AdMob (1)
 Amplitude (1)
 Google Business Profile (2)
 YouTube (1)

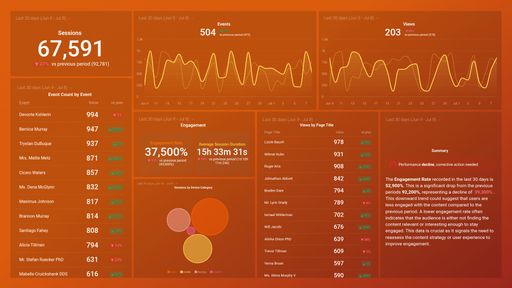
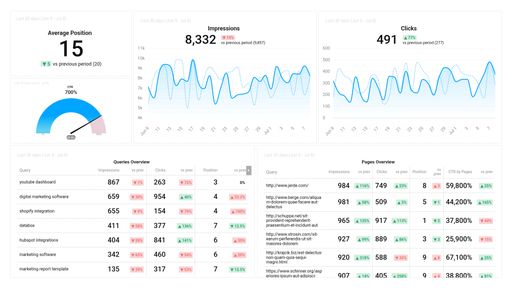
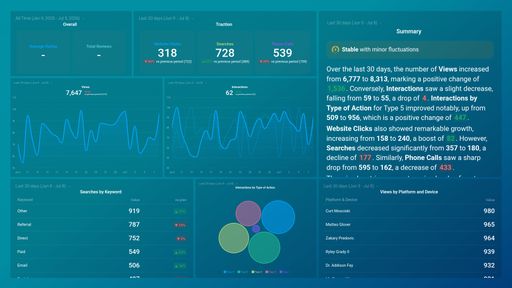
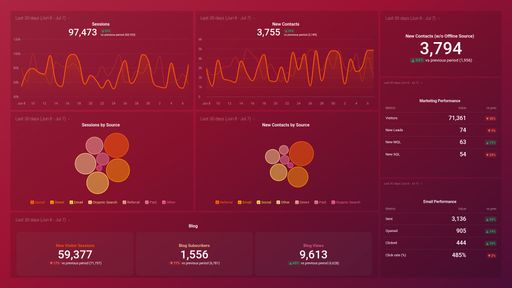
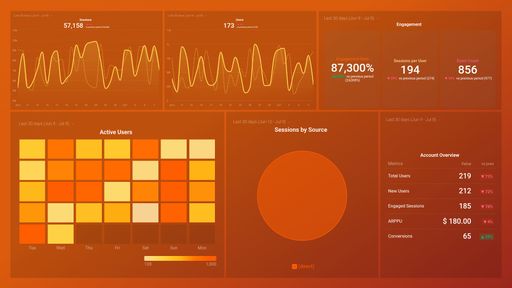
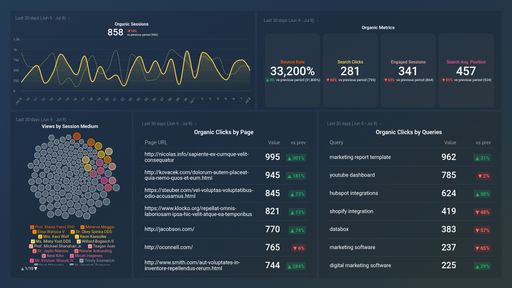
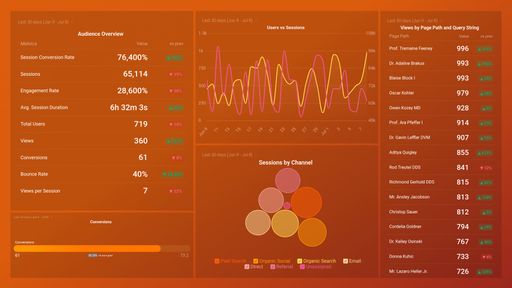
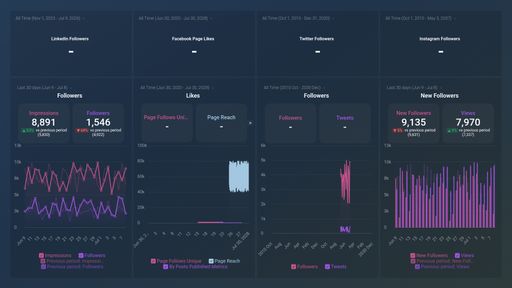
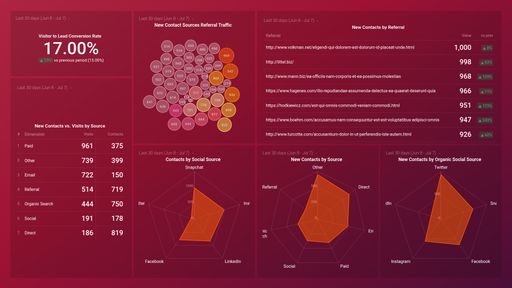
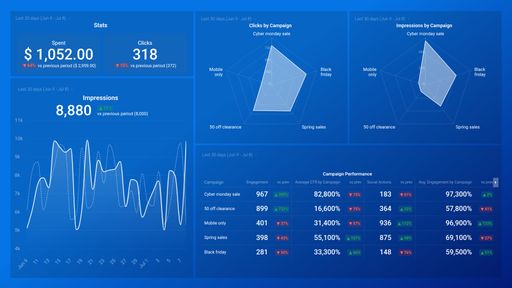
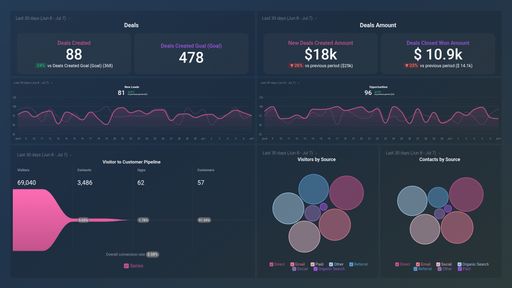
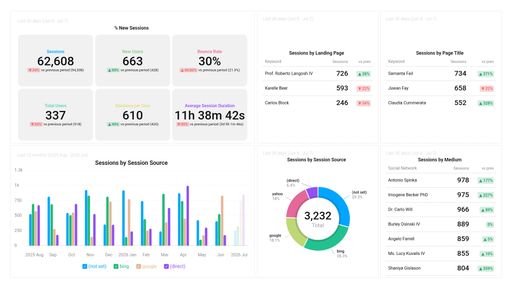
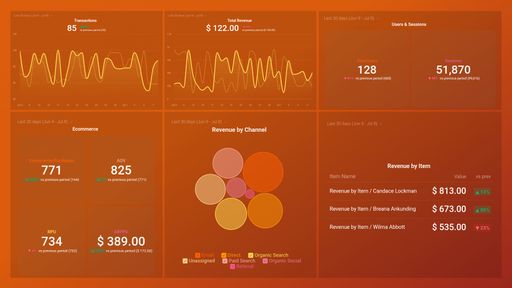
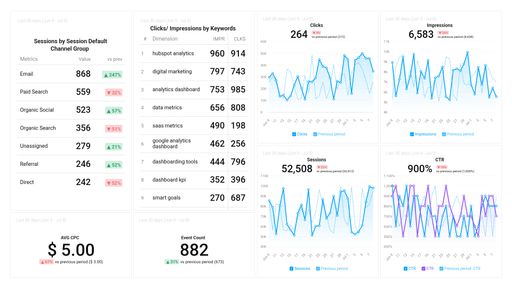
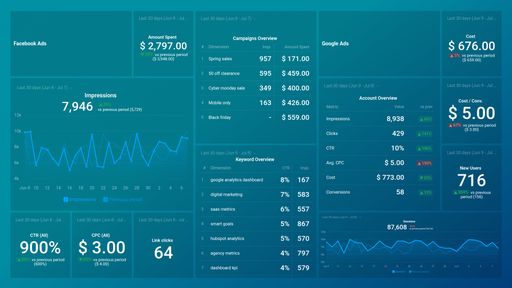
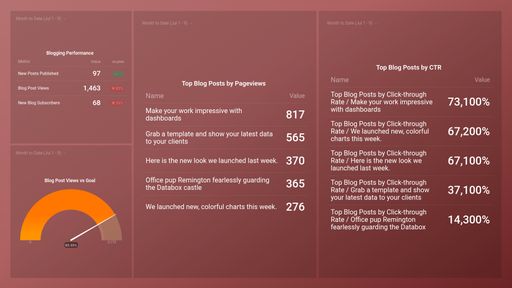
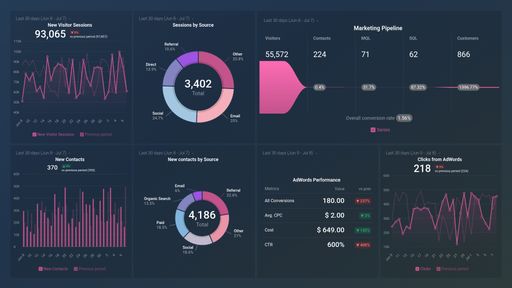
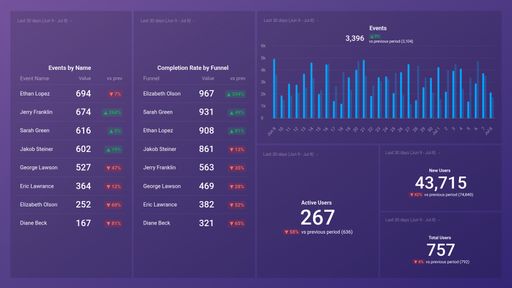
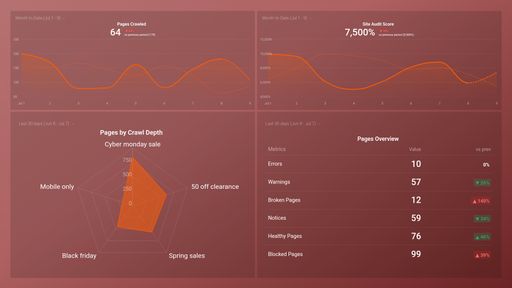
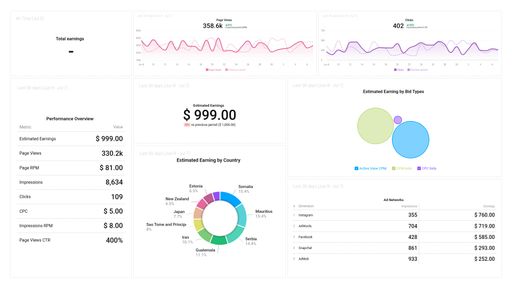
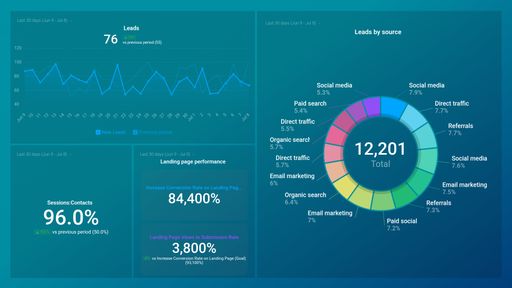
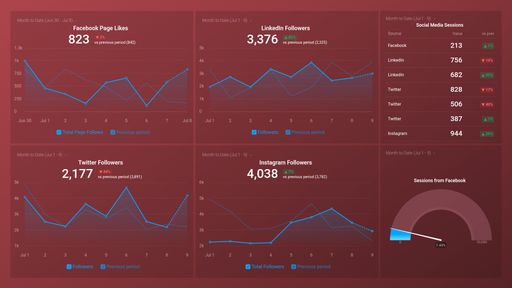
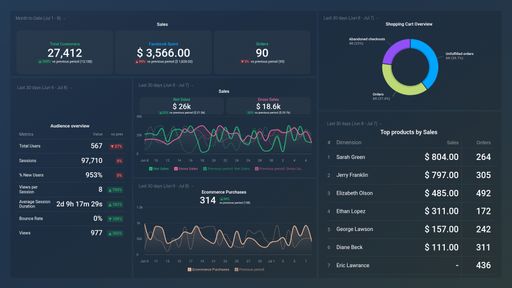
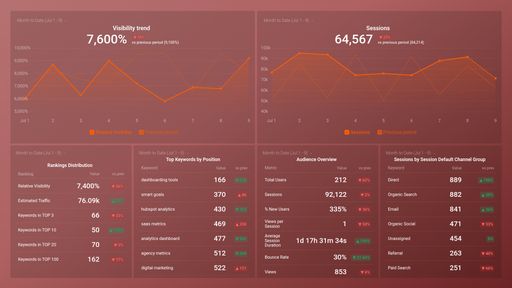
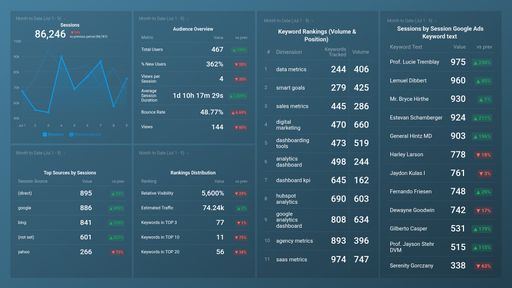
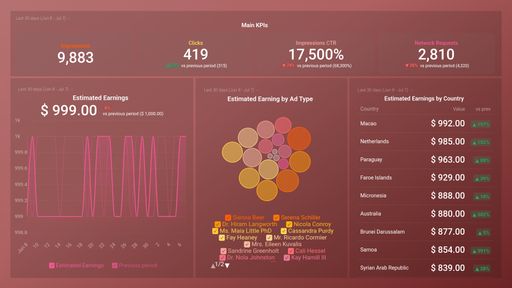
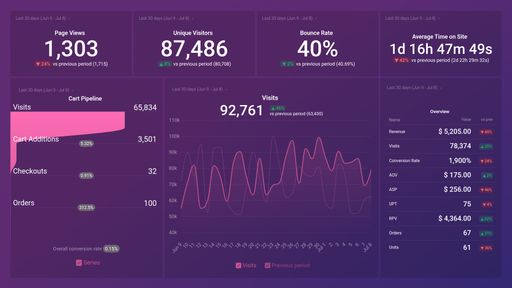
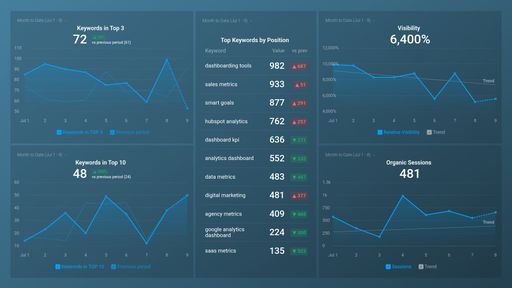
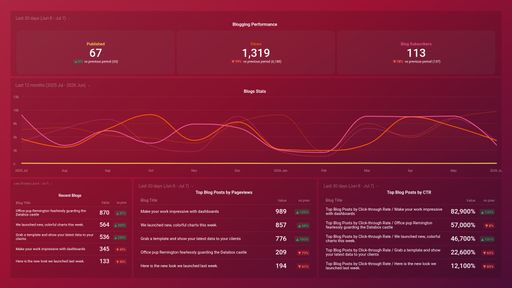
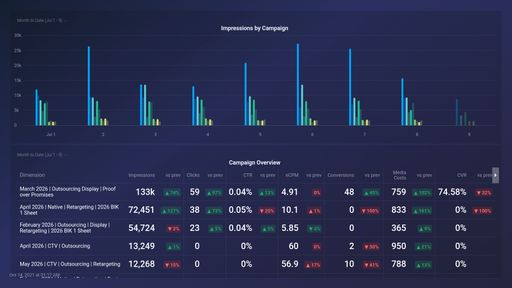
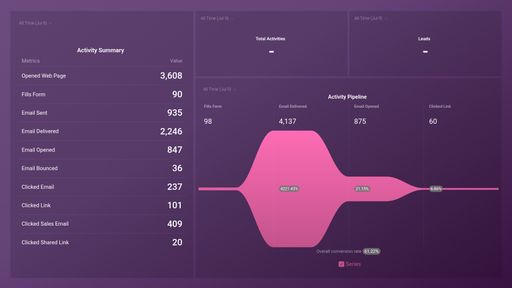
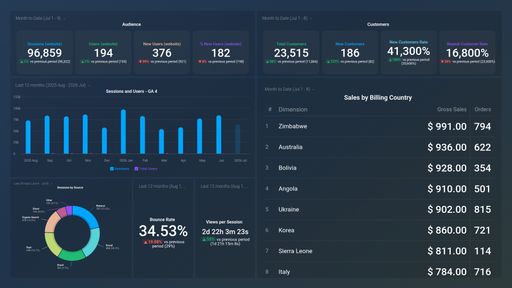
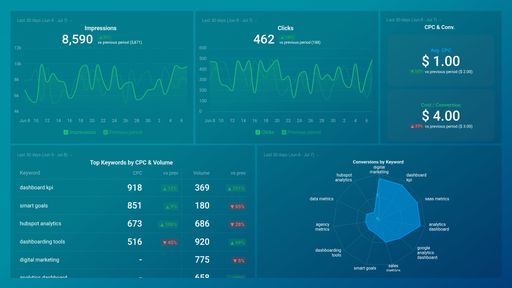
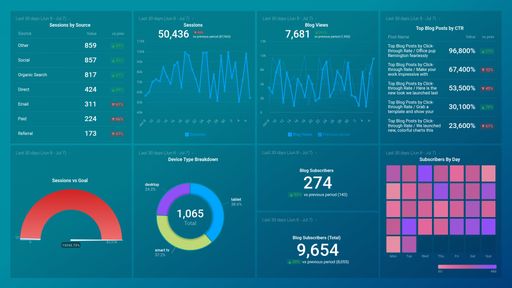
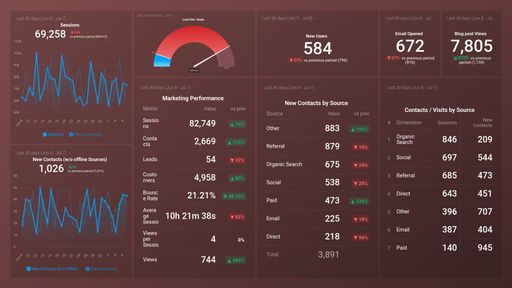
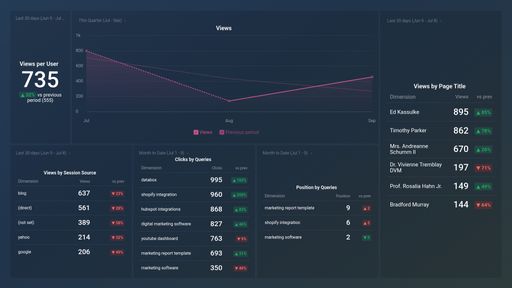
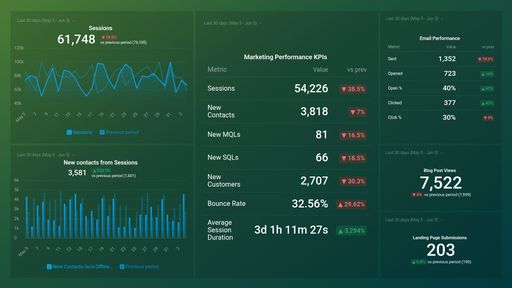
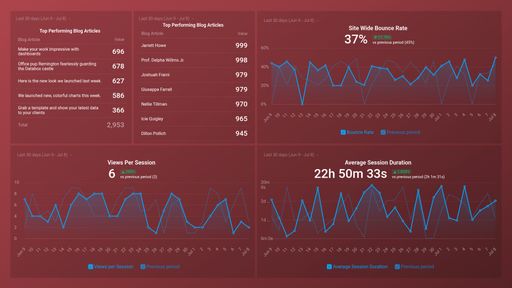
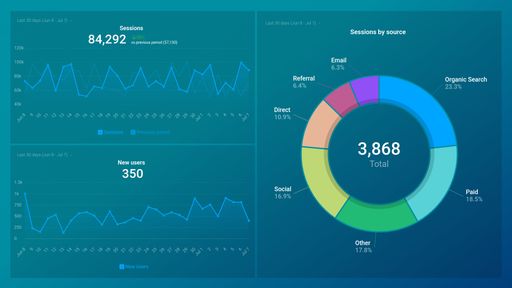
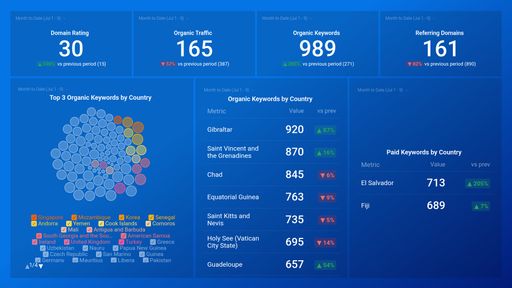
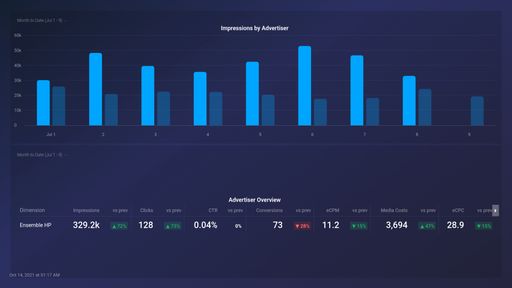
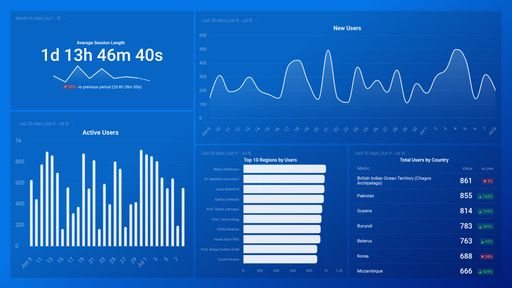
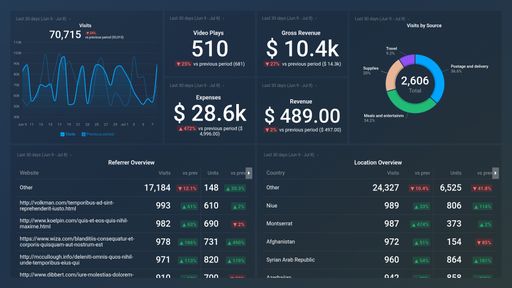
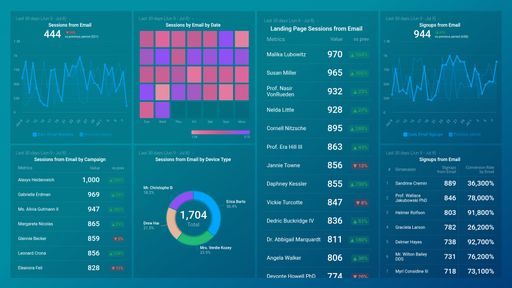
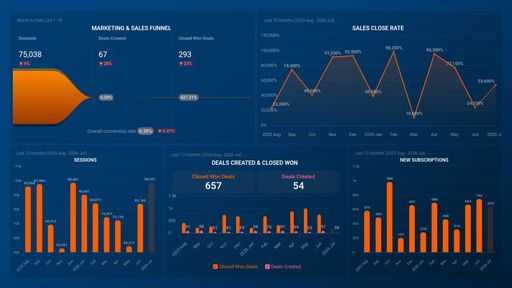
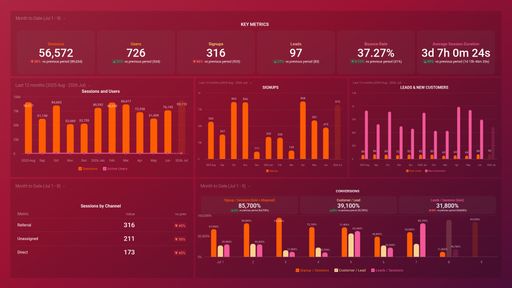
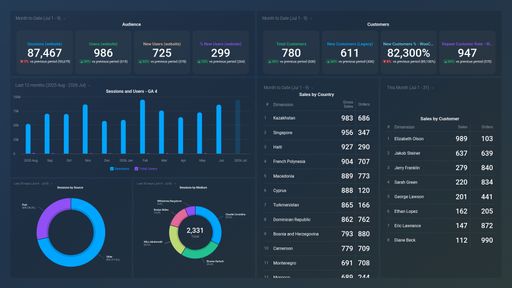
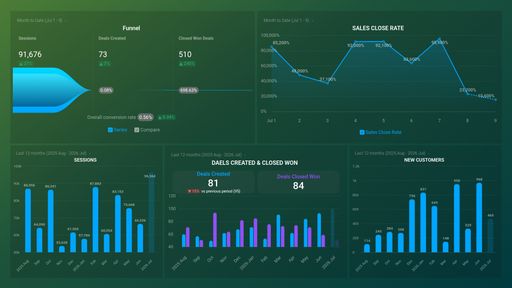
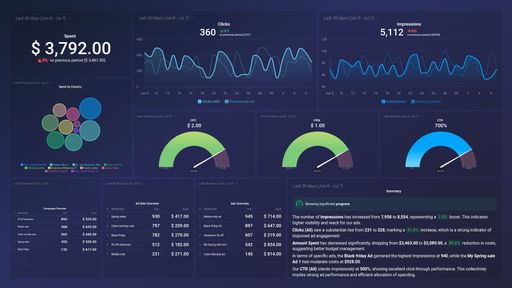
Track some of the most common Web Analytics metrics and KPIs and analyze your Web Analytics performance with just a few clicks.
TOP Web Analytics INTEGRATIONS
Don’t see your SEO tool?
You can build a dashboard with any data using Zapier, Make, Google Sheets, or a SQL database.
You can build a dashboard with any data using Zapier, Make, Google Sheets, or a SQL database.