Uses one-click integrations:
-
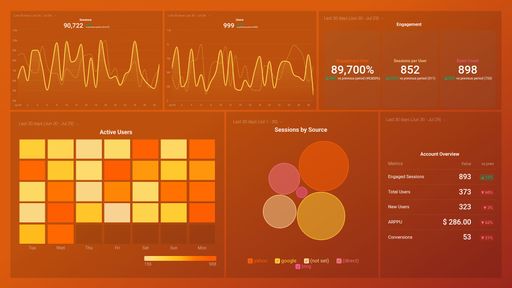
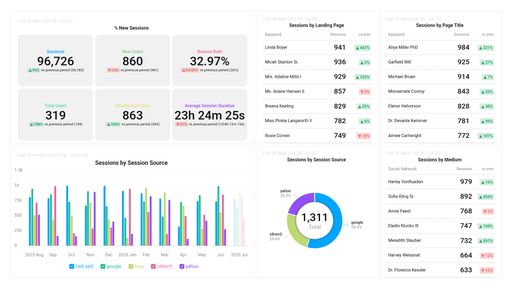
 Google Analytics 4
-
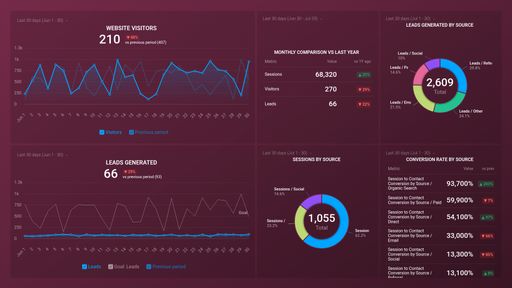
 HubSpot Marketing
If you don't use Google Analytics 4 or HubSpot Marketing, you can pull data from any of our 130+ one-click, native integrations or from spreadsheets, databases and other APIs.
Try this dashboard for free
HubSpot Marketing metrics included in this template
-
Top Blog Posts by CTA Clicks
The Top Blog Posts by CTA Clicks metric tracks the most popular blog posts based on the number of clicks on the Call-to-Action (CTA) buttons within each post.