


Already have an account? Sign in
Sign up for free
Connect your datasources and instantly see your data in this template.
Creating your account...
Stop copying and pasting screenshots into slides. Save hours of work every month, and share the information you need with anyone.

Trusted by 20,000+ growing businesses

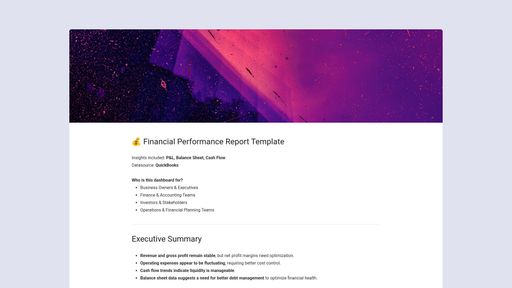
Summarize performance in written-form, so stakeholders can digest it on their own time, then meet to discuss it later.

Format your report into a presentation, complete with speaker notes and full-screen mode.

Build faster with set slide types and format your layout with rows and columns.

Share PDF reports through email or Slack, automatically.

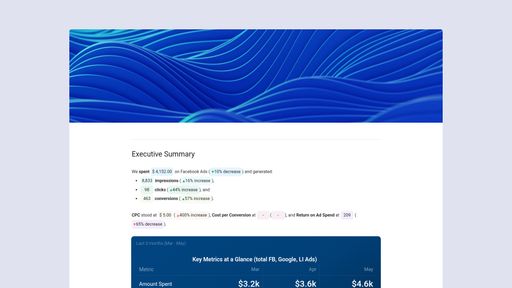
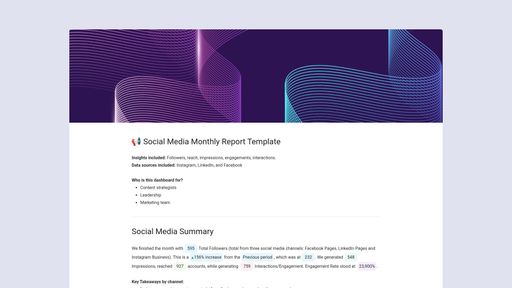
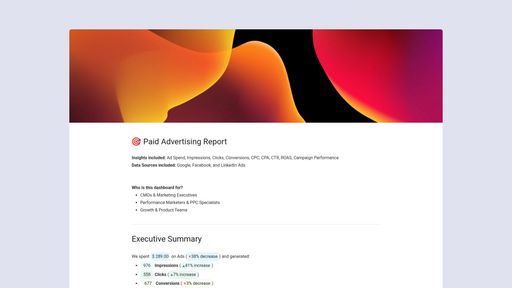
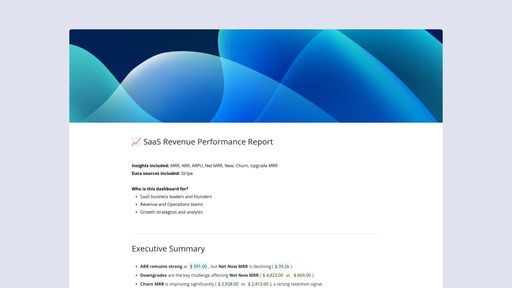
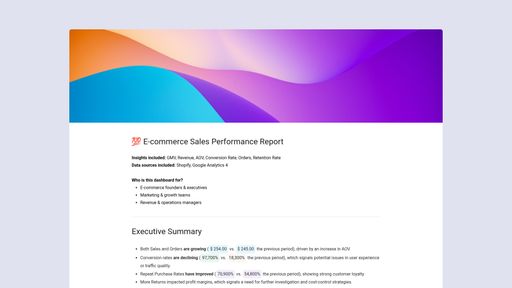
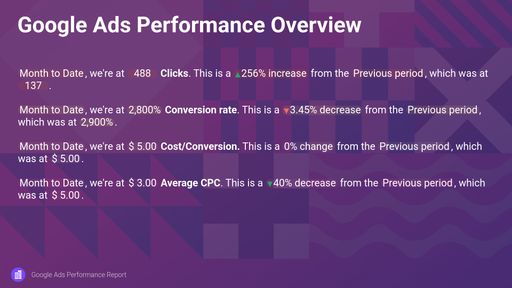
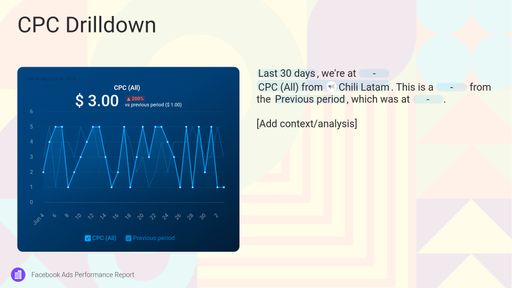
Add dynamic elements like metrics, time periods, and percentage of change to the text of your reports to tell a story with your data.

Get AI-generated performance summaries of key metrics in your report.

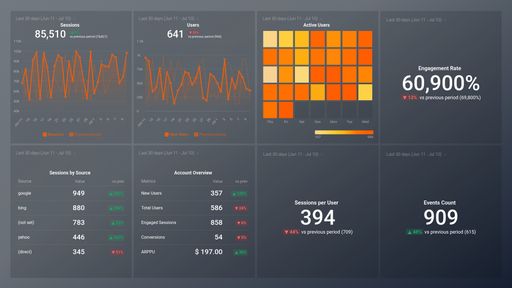
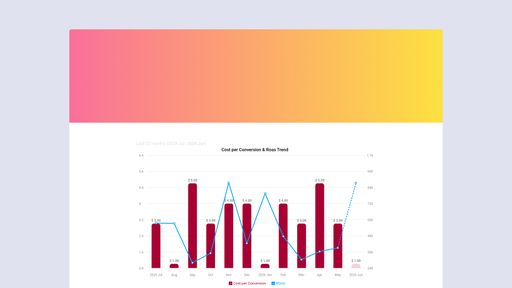
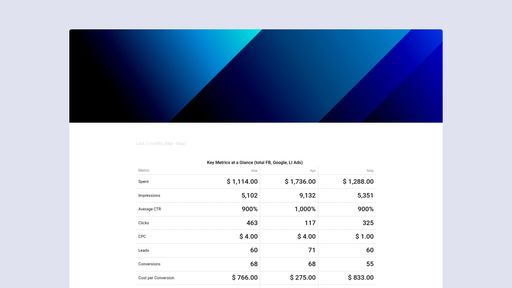
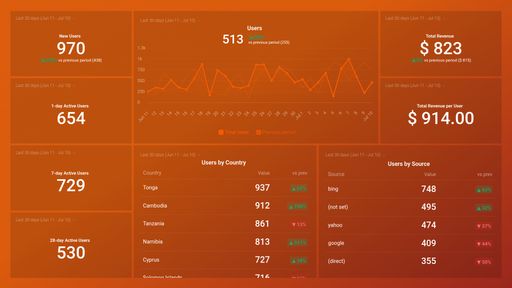
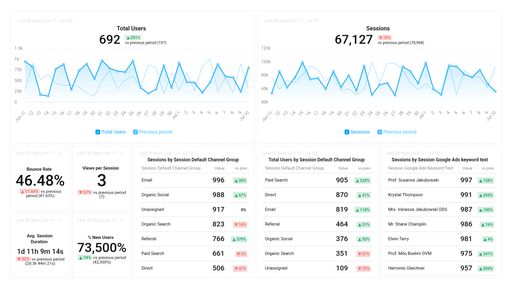
Help readers visualize performance by embedding your existing dashboards, metrics, and goals.

Customize your font, images, logo, and more, to match your company branding.
We took the best tools normally found in complicated enterprise analytics platforms, and made them accessible and easy to use for growing businesses.
Why Choose DataboxLearn how other growing businesses are using dashboards to inform decisions, create plans, and drive growth.
What’s the difference between a Report and a Dashboard?
Dashboards are used to track and monitor your metrics in real-time. It gives you an answer to the question: “How am I doing right now”. They are ideal for “month-to-date” (or week-to-date, quarter-to-date, etc.) data.
Our report generating tool, on the other hand, is designed to offer a more in-depth analysis of historical performance and trends. Typically sent as a PDF, reports cover broader time ranges like last month, last quarter, or last year.
I don’t want to schedule my report, can I download them as PDFs?
Yes. Every Report can be exported as a PDF. You can learn more about downloading a PDF here.
What are Data Stories?
Data Stories are dynamic elements (like metric name, value, comparison periods, and more) that you can add to the text of your Reports. What makes it useful is that these dynamic fields are automatically updated with the latest data every time you send out a Report.
Is there an approval process before the reports are sent out?
Not yet. We will be rolling out a Reports Approval Process for both Growth and Premium plans in the future.
Make sure to check the Product Update page for more information on all the latest features and improvements.
How can I share a Report?
Our business reporting tool allows you to share multiple ways:


Connect your datasources and instantly see your data in this template.
Creating your account...