MARKETING ANALYTICS SOFTWARE
A powerful, but easy-to-use marketing analytics tool
Measure, track, and improve any stage of your marketing funnel
Trusted by 20,000+ growing businesses
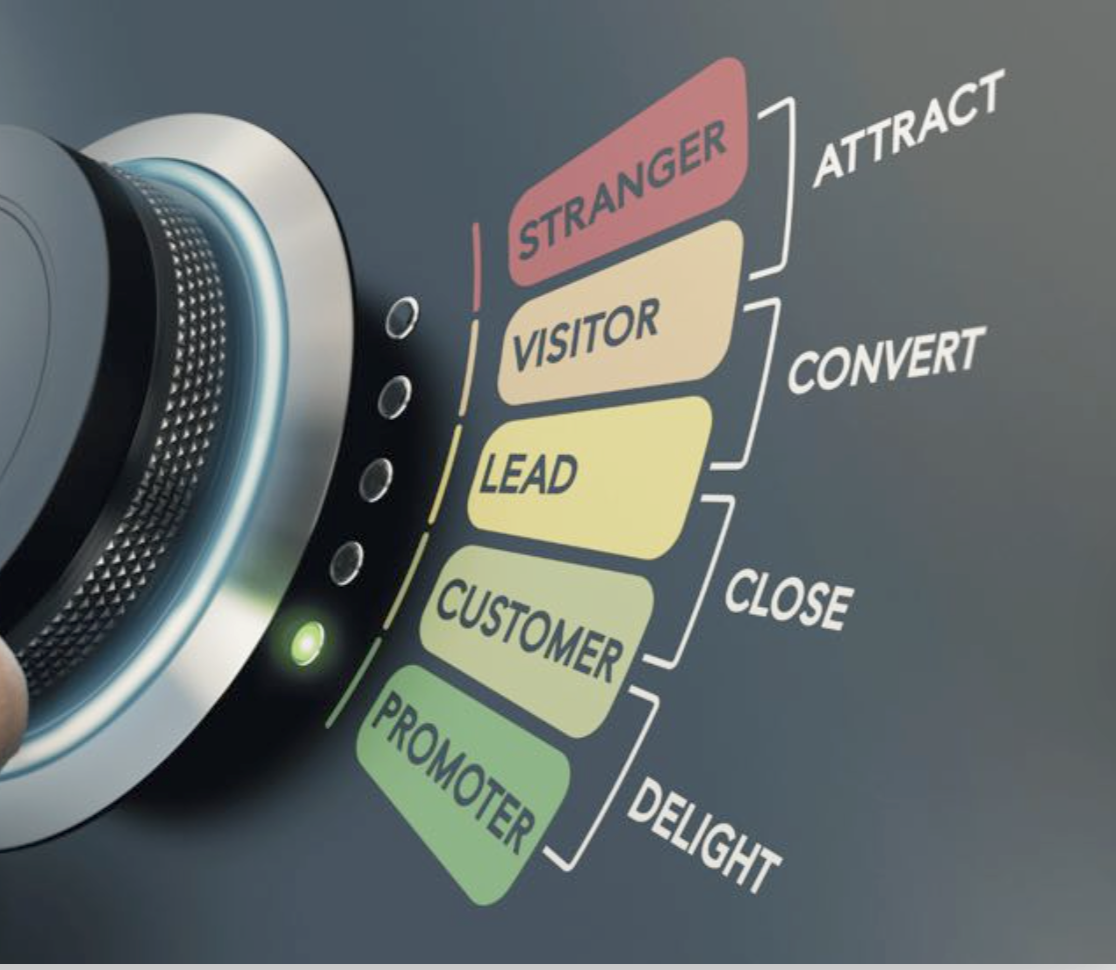
Visualize and improve each stage of your marketing funnel
- Know what’s working and what’s not
- Get automated alerts on all your KPI’s
- Find opportunities to improve any area of your funnel
All-in-one marketing analytics software
METRICS & KPI’s

Track all your marketing metrics in one place
- Create custom metrics like CAC, total brand impressions, or homepage conversion rate
- Send performance updates automatically via email or Slack, and keep everyone updated
- Get alerted when numbers spike or dip, so you can address issues in real-time

DASHBOARDS

Build custom dashboards to visualize your performance
- Build custom dashboards that show data from all your campaigns, side by side
- Compare your current performance to multiple previous periods
- Share links to your dashboards, so your team can view performance on demand

REPORTS

Create automated reports to present to your team
- Automatically send updated slide reports to your leaders, team, or board
- Stop copying and pasting screenshots – add any dashboards to any slides
- Add sentences with dynamic elements to provide context and tell a story with your data

GOALS

Set more accurate goals, and make sure you hit them
- Set more realistic goals based on historical data
- Assign goals to each individual or team you’re managing
- Get alerted if you’re not on track to hit your goals, so you can adjust accordingly

BENCHMARKS

See where you could be performing better
- Compare metrics like ad spend, traffic, and SQL to companies like yours
- See where you’re ahead of the curve, and where there’s room to improve
- Use benchmark data to plan or set goals more accurately

FORECASTS

Create more accurate marketing plans
- Create more accurate marketing plans for the next quarter or year
- Forecast any single metric, from traffic to SQLs
- See the best and worst-case scenario

Use it with the rest of your team
Monitor and improve your entire company’s performance from one place. Each team can customize it to their needs.
-
Leadership
Track and improve your company’s health -
Sales
Visualize and improve your sales pipeline


