
Report & Automate
Share automated reports with stakeholders anytime
Save hours every month and share insights with your team, board, or clients in the format you prefer, instantly.








Build beautiful, comprehensive Reports that tell the full story
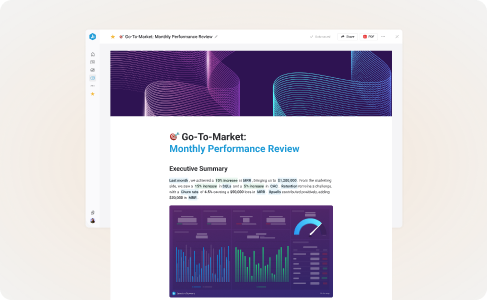
Narrative-ready layouts
Choose Slides for live presentations with speaker notes, or Pages for long-form write-ups you can share anytime.
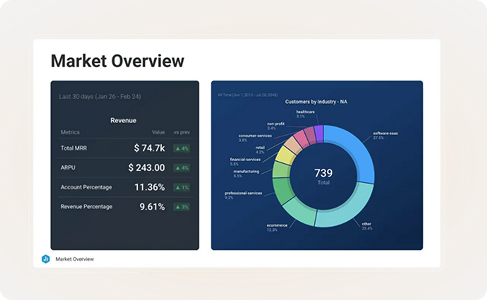
Add all the context you need
Embed any existing dashboards, metrics, and goals into your reports.

Make reports more engaging
Customize your font, images, logo, and more, to match your company branding.
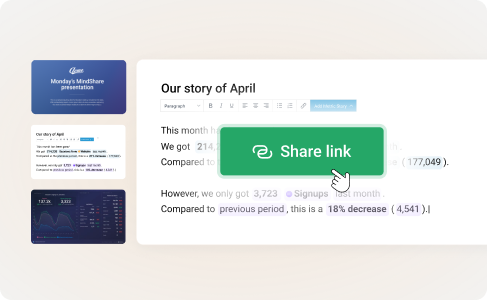
Present live or share async
Run a full-screen presentation with speaker notes, or send a written review for asynchronous review.
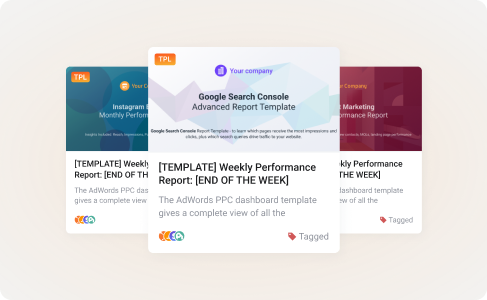
One-click setup & duplication
Get up and running in minutes. Start from a template or copy an existing report, then customize it further to fit your needs and brand.
Get insights in seconds
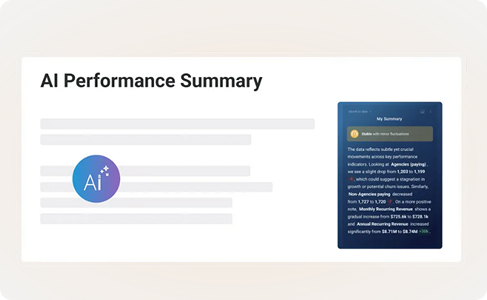
AI-written summaries
Instantly generate AI performance summaries of key metrics in your report, then adjust the tone, length, or details before it ships out.
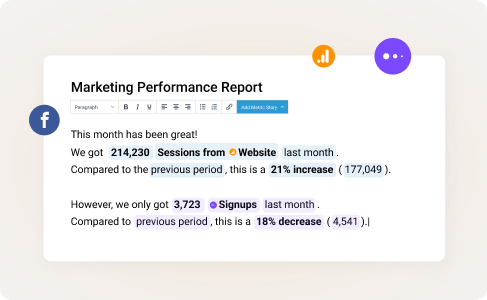
Data Stories
Insert dynamic fields (metric values, % change, date ranges) that update automatically to the text of your reports
Automatically deliver your latest performance data
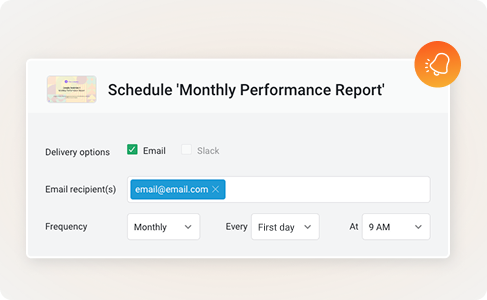
Scheduled or on-demand reports
Schedule reports to be delivered automatically via email or Slack on any cadence you choose with a pre-send reminder for review or share an update right from the editor.
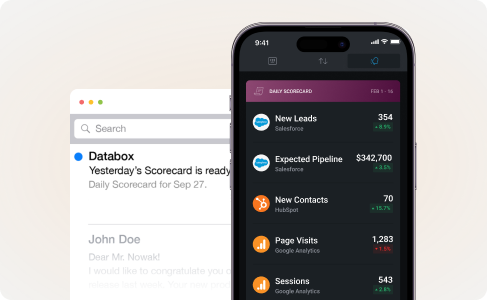
Deliver metrics automatically
Select up to 10 mission-critical KPIs, then have Databox send updates – by email, Slack, or mobile – on your schedule: daily, weekly, or monthly.


Frequently asked questions
What makes Databox different from other reporting tools?
Databox automates the entire reporting workflow – pulling live data into slide- or page-based reports, layering on AI-generated performance summaries, and emailing or Slacking a branded PDF on whatever cadence you set. What sets it apart is a blend of four core advantages:
- Cost-effective by design: every paid plan includes unlimited users and unlimited automated reports, so there are no surprise per-user or per-report fees, and pricing stays accessible for growing teams .
- Exceptionally easy to use: a no-code, intuitive UI means anyone – technical or not – can build and share insights without a steep learning curve .
- Accessible to every teammate: Databox’s unlimited-user model lets the whole company self-serve data instead of waiting on analysts, removing bottlenecks and speeding decisions .
Beautiful, brand-ready outputs: clear, visually engaging dashboards and reports make performance instantly understandable – and fully customizable to match your brand.
How long does it take to build a report in Databox?
Most users start from a one‑click template, drag‑and‑drop Databoards or metrics into place, add commentary, and hit share – often in under five minutes.
Is there an approval workflow before reports are sent?
A built-in multi-step “approve/reject” workflow isn’t live yet, but you can schedule every report to hit your inbox (or a teammate’s) for review before Databox distributes the final PDF or Slack post. That quick review buffer lets you tweak copy, update commentary, or reschedule the send as needed. A more formal approval flow — with status changes and sign-offs — is already on the roadmap, so keep an eye on our Product Updates page for the release timeline.
Can I schedule reports to be sent automatically?
Yes. From the share window you can send a report immediately or set a recurring schedule (daily, weekly, monthly, or quarterly) to any email address(es) or Slack channel.
What delivery and export formats are supported for Databox reports?
A report can be delivered in several formats:
- Download a polished PDF – archive it, attach it, or print it – your choice.
- Send by email or Slack – Databox delivers a PDF straight to inboxes or channels on whatever cadence you set.
- Share a secure link – invite viewers to explore the live report privately or publish it publicly.
- Embed with an iframe – drop the report into any webpage or portal for seamless viewing.
- Present in full-screen mode – walk stakeholders through every slide, complete with optional speaker notes.
Can I put my own branding on reports?
Absolutely. You can brand every report with your logo, custom colours, and background images on any plan, and the optional White-Label add-on lets you take it even further – custom domain, branded login page, custom sender address, and removal of all Databox marks. Once you’ve dialled in the look and feel you want, simply save it as a reusable report template so anyone in your company can spin up identical, on-brand reports in one click – no need to restyle each time.
How can I give clients access to their reports?
Pick the access method that fits your workflow:
- Share a live link – make it public or lock it down with password and IP restrictions.
- Schedule email or Slack sends — PDFs arrive in their inbox or channel on the cadence you set.
- Embed the report – drop an iframe into your own portal for seamless viewing.
- Spin up a Client Account – give them a branded login where they can see dashboards, goals, and archived reports anytime.
Can reports be sent only when certain conditions are met (e.g., goal achieved)?
Databox doesn’t yet support conditional report generation. Instead, use Alerts or Smart Alerts to notify stakeholders instantly when a metric crosses a threshold or a goal is hit, and keep a regular report cadence for context.
Is there a limit to the number of reports I can schedule?
No hard cap is listed in any current plan; you can create and schedule as many reports as you need without additional fees.
How is access to my reports secured in Databox?
Databox offers multiple layers of protection:
• Encrypted delivery (SSL/TLS) for links and PDFs
• Password‑protected or IP‑restricted links
• Option to disable date‑range changes for public links
• Advanced Security Management add‑on for SSO, 2‑FA enforcement and detailed activity logs.