Business Planning Tool
Plan for future growth with confidence
Use your data to make better decisions. Set accurate goals and forecast what’s next – without leaving Databox.


Set goals & track your progress
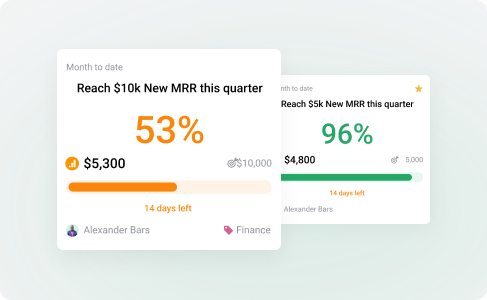
Set a goal for any metric or KPI
Define goals for any metric you already track – standard or custom.
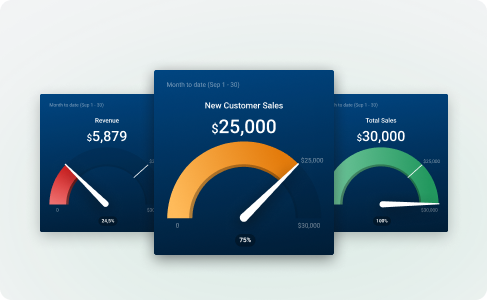
Visualize progress in real time
Gauge charts, progress bars, and traffic-light colors update the moment new data lands, so you can see at a glance whether you’re on, at risk, or off track.
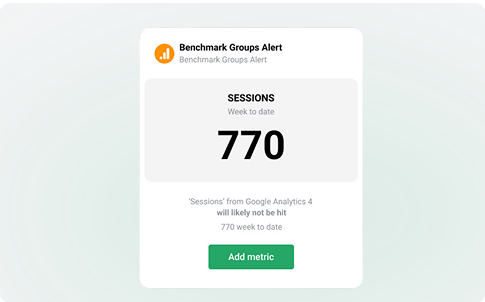
Know when you’re off-track
Automated alerts flag risk early, so you can course-correct sooner.
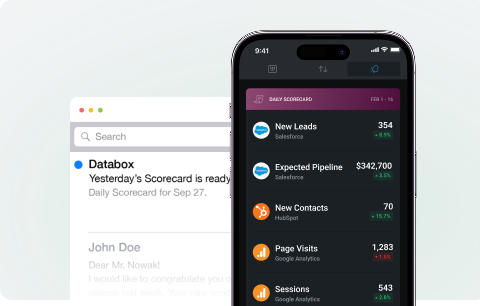
Send scorecards to every stakeholder
Select up to 15 metrics, and get an automated report on how your current performance compares to the goals you set.
Forecast your future performance
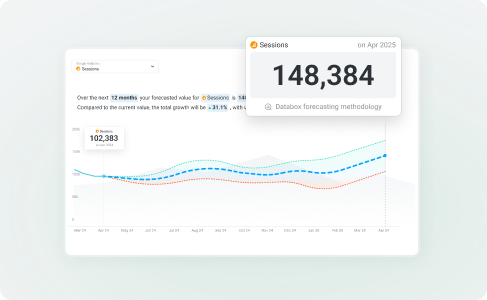
Forecast any metric, for any team
Sales predicts Closed-Won deals while Marketing forecasts traffic – all in one tool.
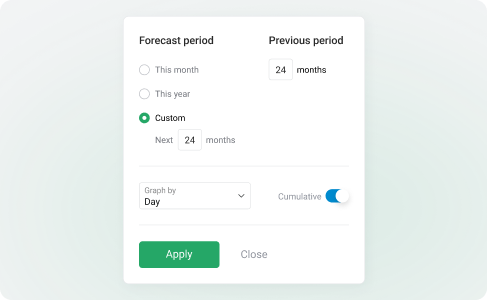
Look ahead 1–24 months
Choose a custom period – from next month to next two years, and account for seasonality.
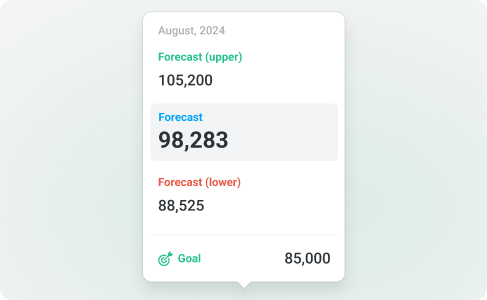
See best- and worst-case scenarios
Use upper forecasts to set ambitious goals, and lower forecasts to plan ahead for uncertainties.
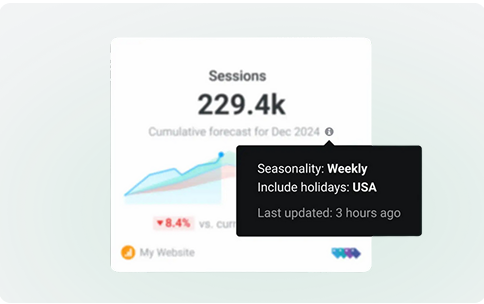
Account for seasonality
Adjust your forecasts to account for real-world factors like holidays, seasonality, and even financial events.
Compare performance to industry benchmarks
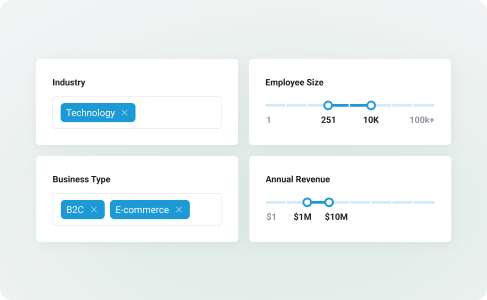
Benchmark explorer
Filter by size, revenue, industry or company type to see how you stack up.
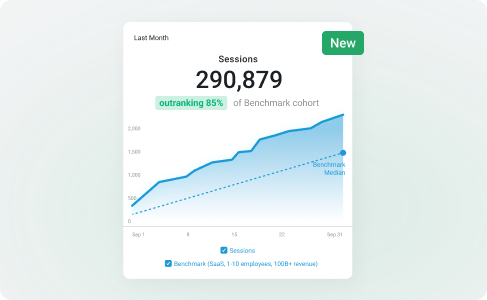
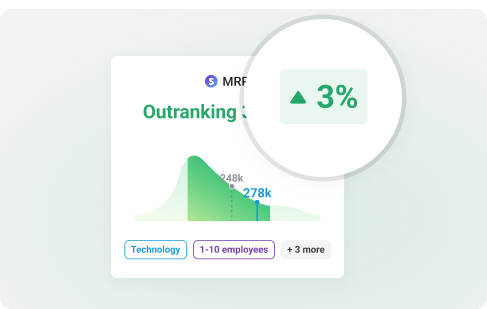
Metric-based benchmarks
Benchmark virtually any metric from any integration and visualize them on dashboards.
Track progress over periods
See how your performance has moved compared to the previous period.
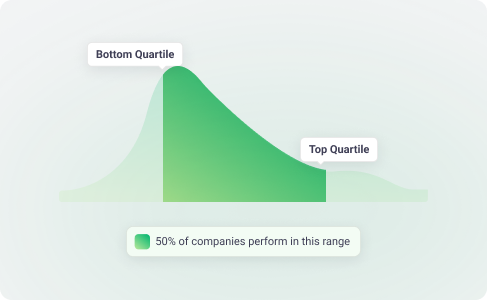
Top vs. bottom quartile views
Instantly see where you’re leading or lagging the pack.
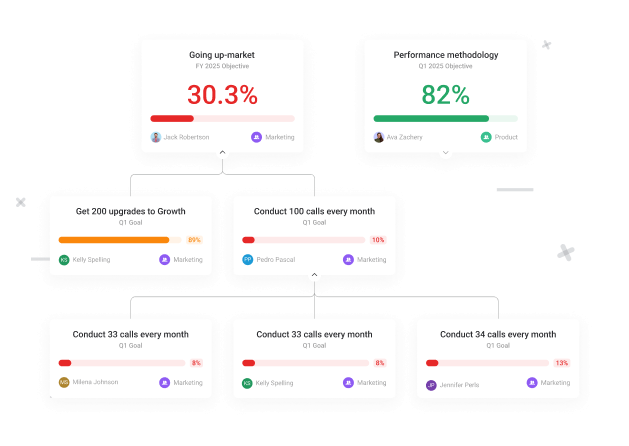
Coming soon: OKR Management
Turn strategy into clear objectives and measurable goals. Define company, team, and individual objectives, break them into goals and sub-goals, assign owners, and keep progress visible across the organization—so everyone stays focused on the work that moves the needle.
Frequently asked questions
What makes Databox different from other dashboard or BI platforms?
Most tools stop at historical reporting. Databox goes further by weaving planning capabilities – Goals, Forecasts, and Benchmarks, directly into every dashboard. You can set numeric targets, project best- and worst-case outcomes up to 24 months ahead, and compare performance against thousands of peer companies without exporting data or buying add-ons. The result is a single, affordable workspace that delivers the best of BI without the complicated setup, steep price, or long learning curve. It’s intuitive enough for any team member, thanks to a no-code, friendly UI that lets everyone self-serve insights, yet still packs beautiful, brand-ready dashboards and reports you can customize in minutes.
How do I choose the right KPIs for my business inside Databox?
Start in Metric Library, where 300+ one-click dashboard templates are sorted by industries: SaaS, e-commerce, agencies, finance, and more. When you connect a data source, Databox highlights the metrics most commonly tracked for that tool and lets you import an entire template in seconds. Next, you can then open the Benchmark Explorer to see how those metrics perform across companies of a similar size, revenue band, or vertical, making it easy to validate (or replace) the KPIs you selected.
Can I set different targets for different time periods?
Yes. When you create a Goal you can choose a granularity of daily, weekly, monthly, quarterly, or yearly, enter either a fixed value or a % change (e.g., +10% MoM), and even specify a target end‑date for progressive “ramp‑up” goals. Databox automatically rolls those sub‑targets forward, updates progress in real time, and keeps the historical schedule intact for audit purposes.
How does Databox help with strategic planning, not just tracking?
Databox links strategy to execution in three ways:
- Scenario Forecasts show the most‑likely, optimistic, and pessimistic trajectories for any metric, helping you stress‑test plans before you commit.
- Goal‑vs‑Forecast views let you compare those scenarios to your live targets so you can adjust budgets or resources early.
- AI Performance Summaries surface the biggest drivers behind each metric and suggest next steps, shortening the analysis loop for leadership teams.
Because these features live inside the same dashboards you use every day, strategic planning becomes a continuous, data‑driven process instead of an annual spreadsheet exercise.
Can multiple teams own different goals in Databox?
Yes. You can assign goals to specific teams or individuals and view them all in one place, making it easy to see who needs support.
Can I get alerted if I’m unlikely to hit a goal?
Yes. You can set two kinds of Alerts. The first notifies you if you are likely/unlikely to hit your goal after 70% of the specific time period has passed, and the second type of Alert will tell you whether or not you’ve hit your goal once the specified time period has expired.
Do I need to be a user to track goals in Databox?
Yes. Only Databox users can create Goals and track them on the Goals page. However, Goals can be added to your dashboards using the Gauge or Progress visualization type. This means that anyone with access to the dashboard (including non-users) can track Goals.
Can Databox track my progress toward annual goals automatically?
Absolutely. Progress bars and pace indicators refresh the moment new data syncs. If the current run‑rate won’t hit the year‑end target, Databox projects the shortfall and highlights it in red. You can also layer the Forecast curve on top of the Goal line to see where you are likely to land, and set Alerts so stakeholders know the moment the goal drifts off track.
How do I keep departmental KPIs aligned with company objectives?
Create Spaces for Marketing, Sales, Customer Success, etc., assign a Goal owner for each KPI, and pin every department’s dashboards to a shared “Executive” view. Because all teams pull from the same prepared datasets, metrics are calculated once and reused everywhere, which eliminates version‑control headaches and keeps everyone focused on the same north‑star numbers.
What tools does Databox provide when we’re falling behind our targets?
Smart Alerts fire automatically (via email, Slack, or mobile) when trend analysis shows you’re unlikely to hit a goal 70 % of the way through the period.
- AI Performance Summaries call out the largest contributing factors and recommended actions.
- Scenario Forecasts recalculate in real time so you can see the downstream impact on quarterly or annual objectives, while Benchmarks reveal whether the dip is market‑wide or specific to your team.
Together these tools turn a missed pace alert into a concrete recovery plan.
How does Databox keep my strategic data secure?
Databox is hosted on AWS and follows enterprise‑grade security practices: TLS 1.2+ encryption in transit, AES‑256 encryption at rest, key management through AWS KMS, GDPR compliance for all customers, role‑based access controls, and detailed audit logs. Optional SSO/SAML and IP‑whitelisting are available.


compliant
certified