Data Preparation Software
Prepare your data for faster, more confident decisions
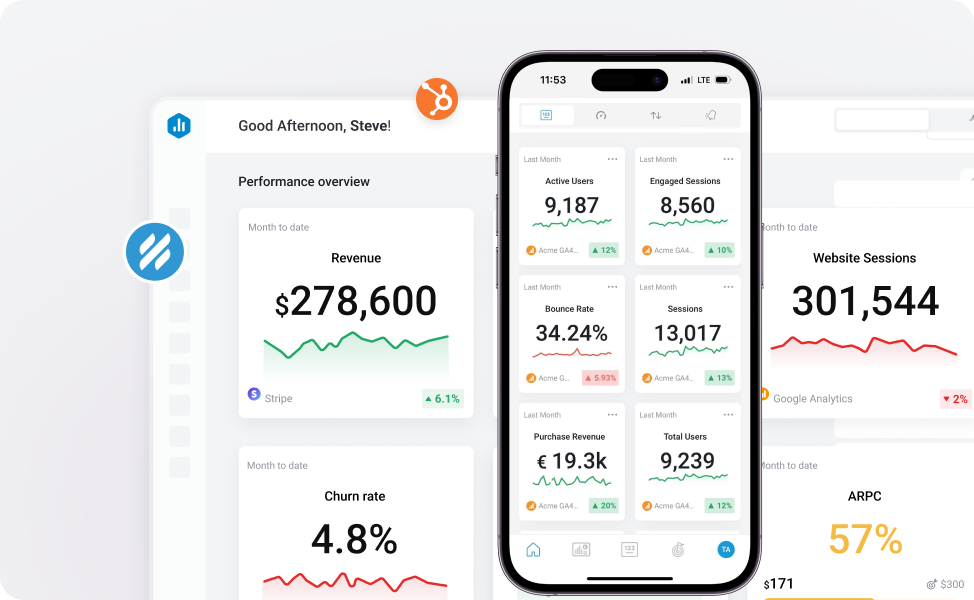
Easily turn raw data into reliable metrics your team can explore, share, and act on.


Transform data into a clean, analysis-ready format.
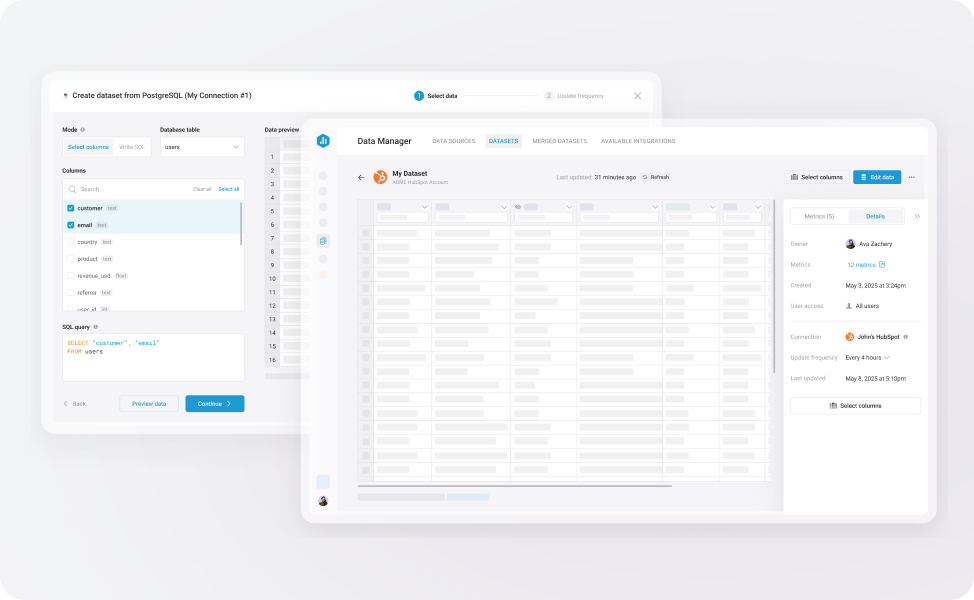
Create datasets
Filter out irrelevant data, change data types, and customize columns.
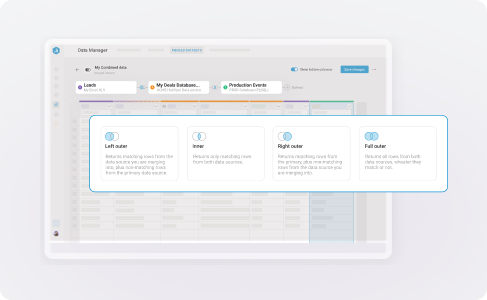
Merge datasets together
Blend multiple datasets to analyze data across multiple integrations.
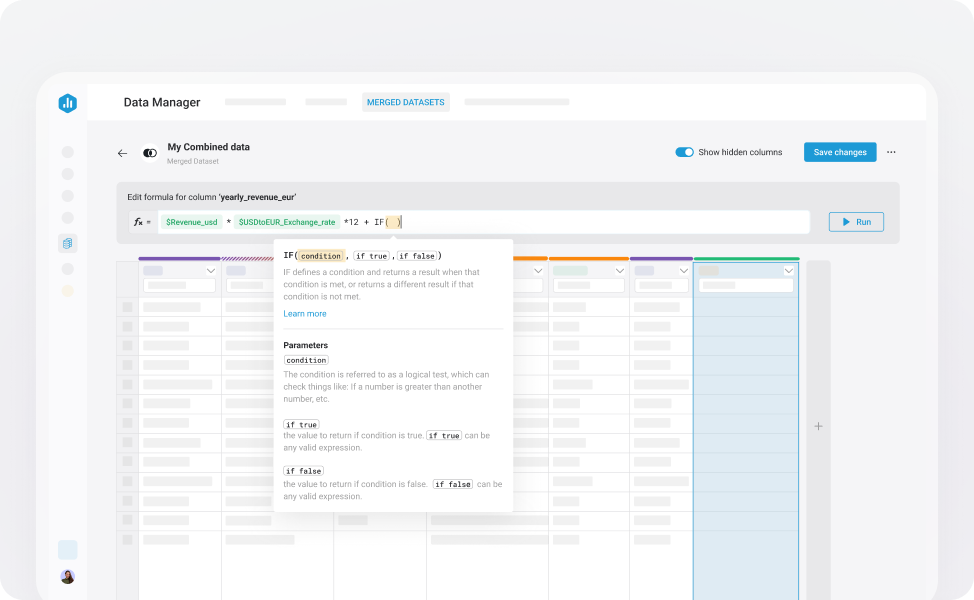
Create derived metrics
Calculate columns together to create an entirely new one.
Define custom metrics to track what matters.
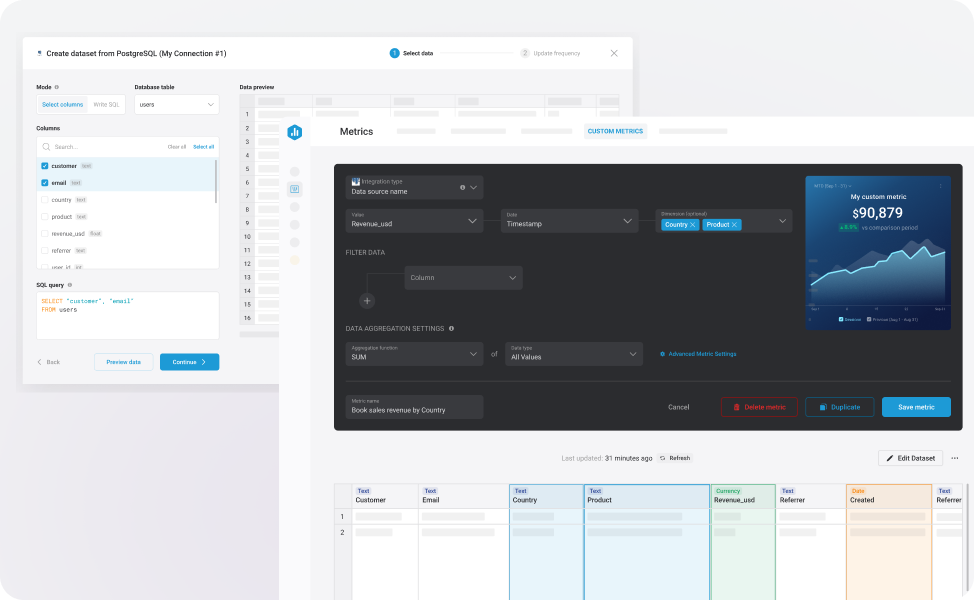
Build custom metrics
Create metrics from datasets or data sources, with multiple dimensions & filters.
Define once, track anywhere
Empower your team to visualize, share, or analyze metrics over time.
Frequently asked questions
What makes Databox different from other data prep or BI tools?
Traditional BI tools often come with high setup costs, complex data modeling requirements, and a steep learning curve.
With Databox, you don’t need analysts to pull reports, engineers to model data, or extra tools to sync it. You get a modern, all-in-one platform that helps your entire team track performance, surface insights, and make better decisions, faster.
Databox is designed for business users, not just data teams. Unlike traditional BI platforms that require technical setup or ongoing analyst support, Databox offers a visual, no-code environment where anyone can clean, merge, and transform data for analysis.
How does Databox help clean and standardize messy data?
When building a dataset, you can:
- Standardize your data by formatting values as numbers, dates, or currencies
- Filter out irrelevant or incomplete rows to clean your data and focus your analysis on what truly matters
- Apply formulas and functions to create entirely new fields based on your business logic
Can I combine data from multiple sources into one metric?
Yes. With merged datasets, you can join data from different tools into a single table. From there, you can filter your data, standardize formats, calculate new columns, and build custom metrics that data – all without writing any code.
Will I lose any historical data when I connect a new data source?
No. When you connect a data source, the amount of historical data that’s initially synced depends on both your Databox plan and the data source itself.
Each tool that we integrate with has its own limits on how much historical data can be pulled through its API, though most support 12 to 24 months. Your Databox plan then determines how much of that historical data you can report on:
- Professional: Up to 24 months
- Growth and Premium: Unlimited access to all available history from the source
How can I trust that my data is accurate?
Every dataset in Databox includes a sync history, so you can see exactly when it was last updated and whether the sync was successful.
You can also trigger a manual refresh on your dashboards at any time to make sure you’re working with the most up-to-date data.
Can I define how a metric is calculated?
Yes. In Databox, you can control exactly how your metrics are calculated. Use formulas and functions to create new calculated columns directly within your datasets. Then, turn those columns into custom metrics that reflect your specific definitions, filters, and business logic.
Do I need technical skills to use Databox for data prep?
No. Databox offers a no-code interface that makes it easy to clean, filter, and model data – no matter your technical skills.
If you’re working with a SQL database, you can choose to write custom queries for more control, but it’s completely optional.
How is my data kept secure?
Databox keeps your data secure through a combination of robust security infrastructure and granular access controls.
Security & Compliance:
Databox is hosted on AWS and uses AES‑256 encryption at rest and TLS 1.2+ encryption in transit. We follow enterprise-grade practices like VPC isolation, OAuth 2.0 authentication, 24/7 monitoring, and quarterly penetration testing. Databox is GDPR-compliant and inherits AWS’s ISO 27001, SOC 1/2/3, and PCI-DSS certifications. SOC 2 attestation is in progress.
Permissions & Access Control:
You can restrict access at the account, data source, metric, or dashboard level using role-based permissions. Advanced Security Management is available as an add-on or included in the Premium plan, which adds forced SSO/2FA, IP whitelisting, session controls, and activity logs.


compliant
certified