
DATABOX FOR ANALYSTS
Empower your company to use data, without bottlenecks
Connect data from all your tools, build custom metrics from a curated source of truth, and give your teams the dashboards they need to improve performance, faster.
Trusted by thousands of growth-minded CEOs & Founders







Put data to work across the company
INTEGRATIONS
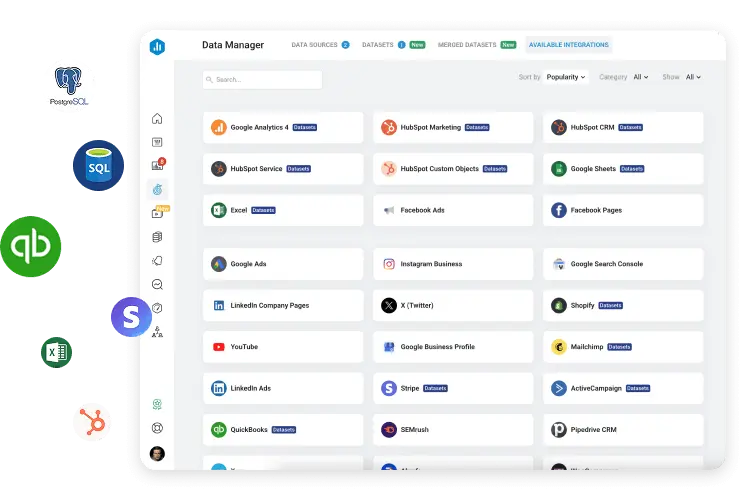
Centralize all your company’s data in one place
- Connect to 130+ popular tools across sales, marketing, finance, and ops
- Pull in custom data from spreadsheets like Google Sheets and Excel
- Visualize backend data from SQL databases without writing code
DATASETS
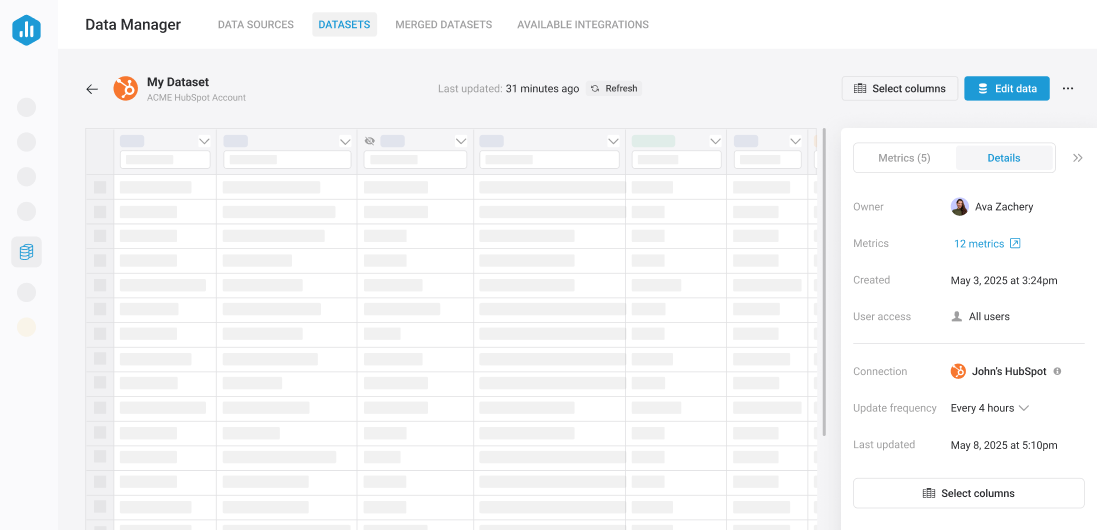
Prepare data for advanced analysis
- Build a curated table of raw data from one or more sources
- Apply filters, change field types, and create new calculated columns
- Build custom metrics that everyone can trust
- Drill down to row-level data to see what’s driving performance
METRICS & KPIs
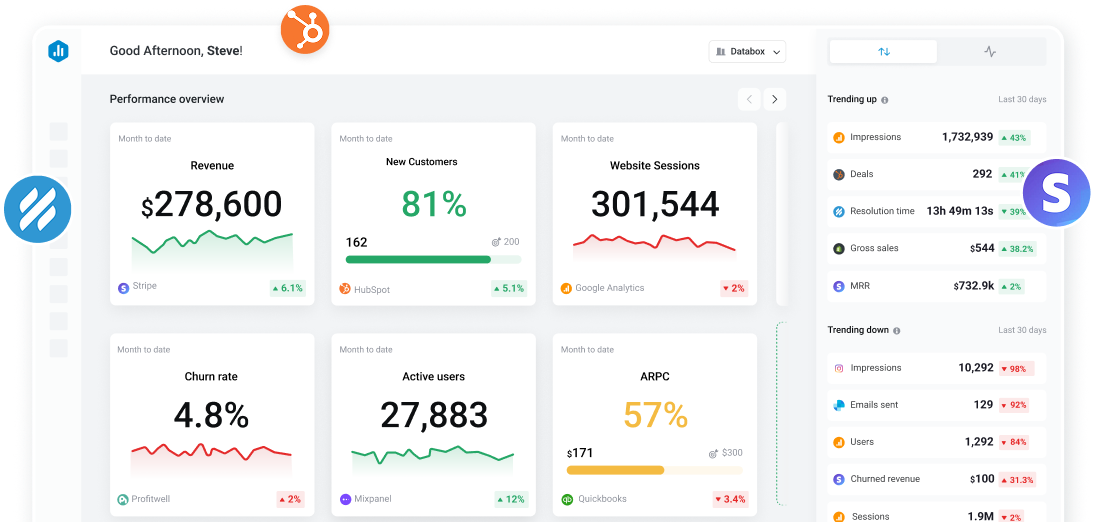
Help your team track the metrics they care about
- Apply filters, segments, and dimensions to save the exact metric you need
- Combine data across sources to create metrics like Conversion Rate or ROAS
- Access hundreds of ready-to-use metrics from your connected tools
DASHBOARDS
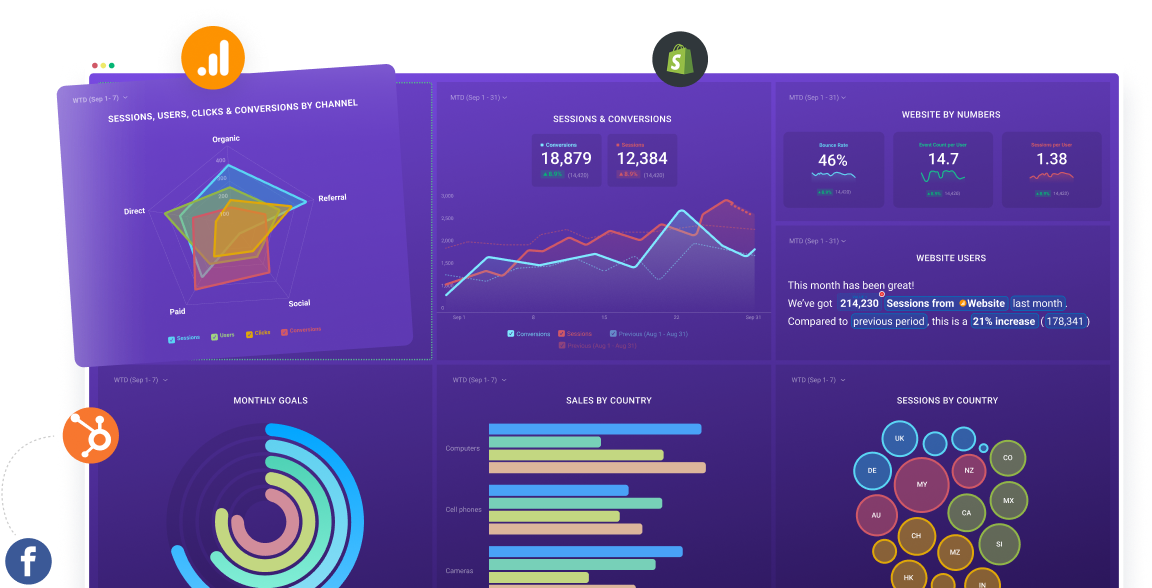
Centralize performance and give every team clarity
- Combine data from multiple tools into one trusted view
- Analyze trends by drilling into row-level data, applying filters, and using comparison periods
- Enable leaders and managers to self-serve insights anytime
- Share dashboards instantly via link or schedule automated delivery
REPORTS
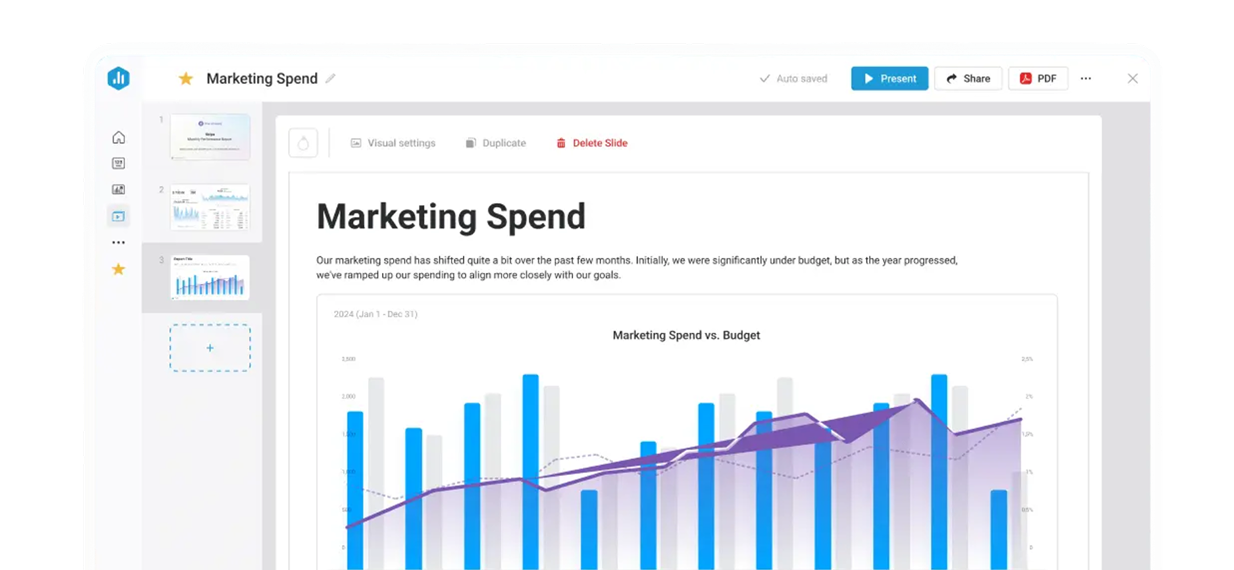
Automate leadership updates
- Replace manual spreadsheets and slide decks with automated Reports
- Deliver board-ready updates with metrics, historical comparisons, and AI-written context
- Share reports asynchronously using a live link or present live with presentation mode
FORECAST
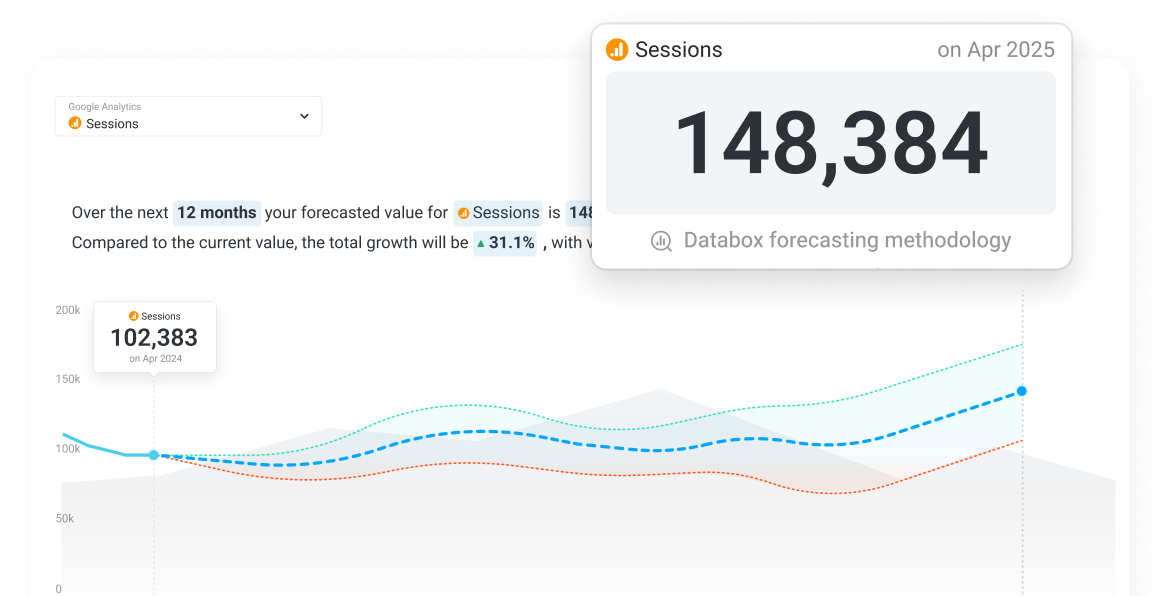
Model future performance with confidence
- Forecast future performance for any KPI, like revenue, pipeline, churn, or more
- Factor in seasonality and holidays for more accurate predictions
- Run scenario analyses to guide decision-making (coming soon)
OKR (COMING SOON)
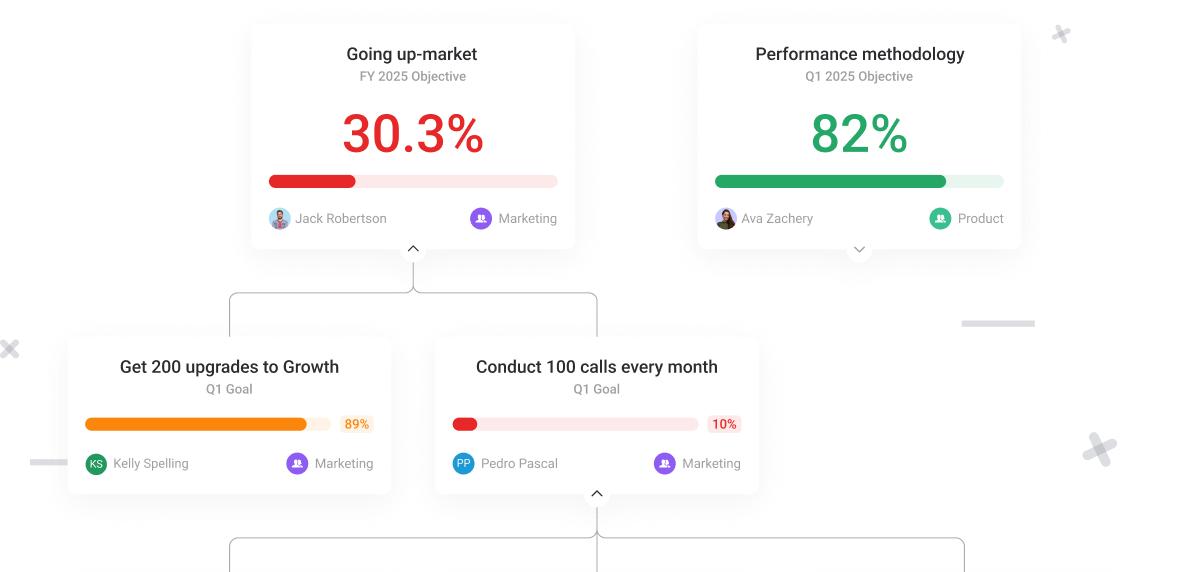
Give leadership visibility into strategy execution
- Translate company objectives into measurable metrics that leadership can monitor
- Build alignment by tying department dashboards to top-level OKRs
- Keep progress visible and consistent across the org
TEAMS
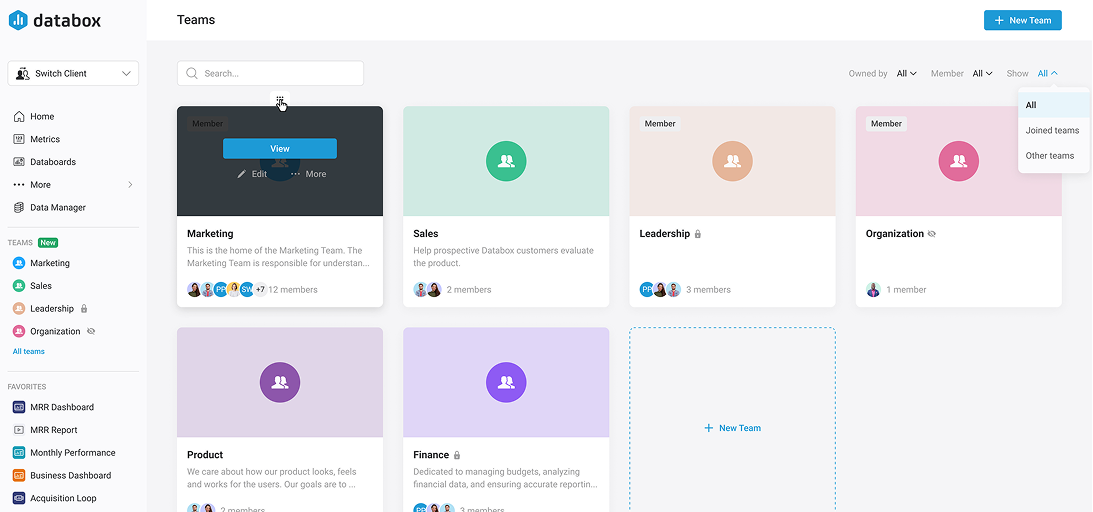
Give every team the data they need
- Create dedicated spaces and add the metrics, dashboards, and reports that are most relevant
- Organize each space by department or project
- Enable every team to self-serve data
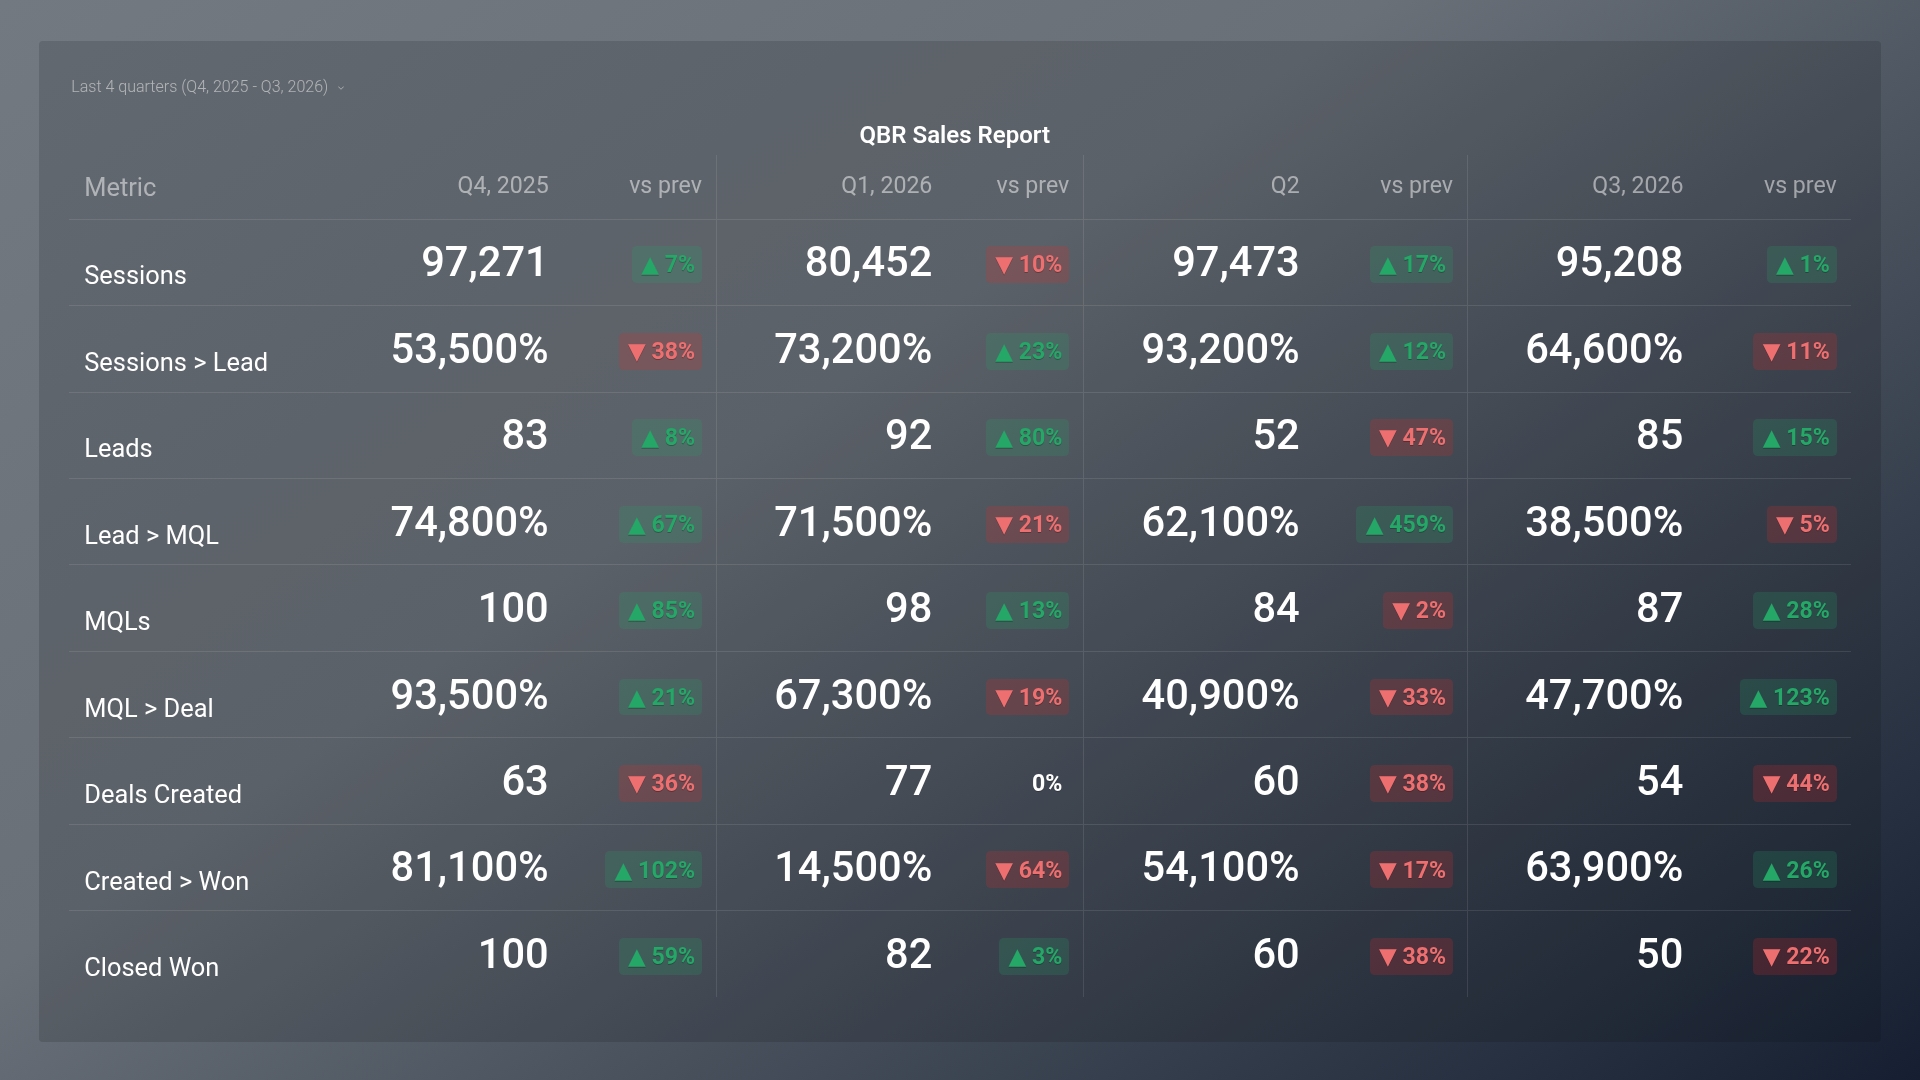
Start with a template built for analysts
“The most interesting thing about Databox is its flexibility; the general interface is very intuitive. There are several resources and tools you can use to configure your dashboards to meet your current needs. As a marketing data analyst, I am very happy. It brings all our data together in one place. We build live/interactive dashboards, which I can access on a PC or a mobile device. Setting it up is very simple. I admire this software for its organization and structure."
See how the rest of your company can use Databox
From company-wide strategy to campaign execution, Databox helps every team use data to do their job better.
-
Executives
Track high-level KPIs and drive alignment. -
Functional Leaders
Monitor team performance and guide priorities. -
Team Contributors
Track key metrics and execute day-to-day work within a team. -
Agencies
Report performance and deliver insights to clients.