Free to start, built to scale
Start on a 14-day free trial of the Growth plan, then choose the plan that's right for you.
- 1 user Invite team members and control access by assigning roles that define what each person can see and do in Databox.
-
50
AI credits/mo
 The number of AI credits available each month to power Genie and the MCP server. Credits are shared across the account and reset monthly.
- Cloud integrations Sync data from popular tools like HubSpot, Google Analytics 4, Facebook Ads, and more.
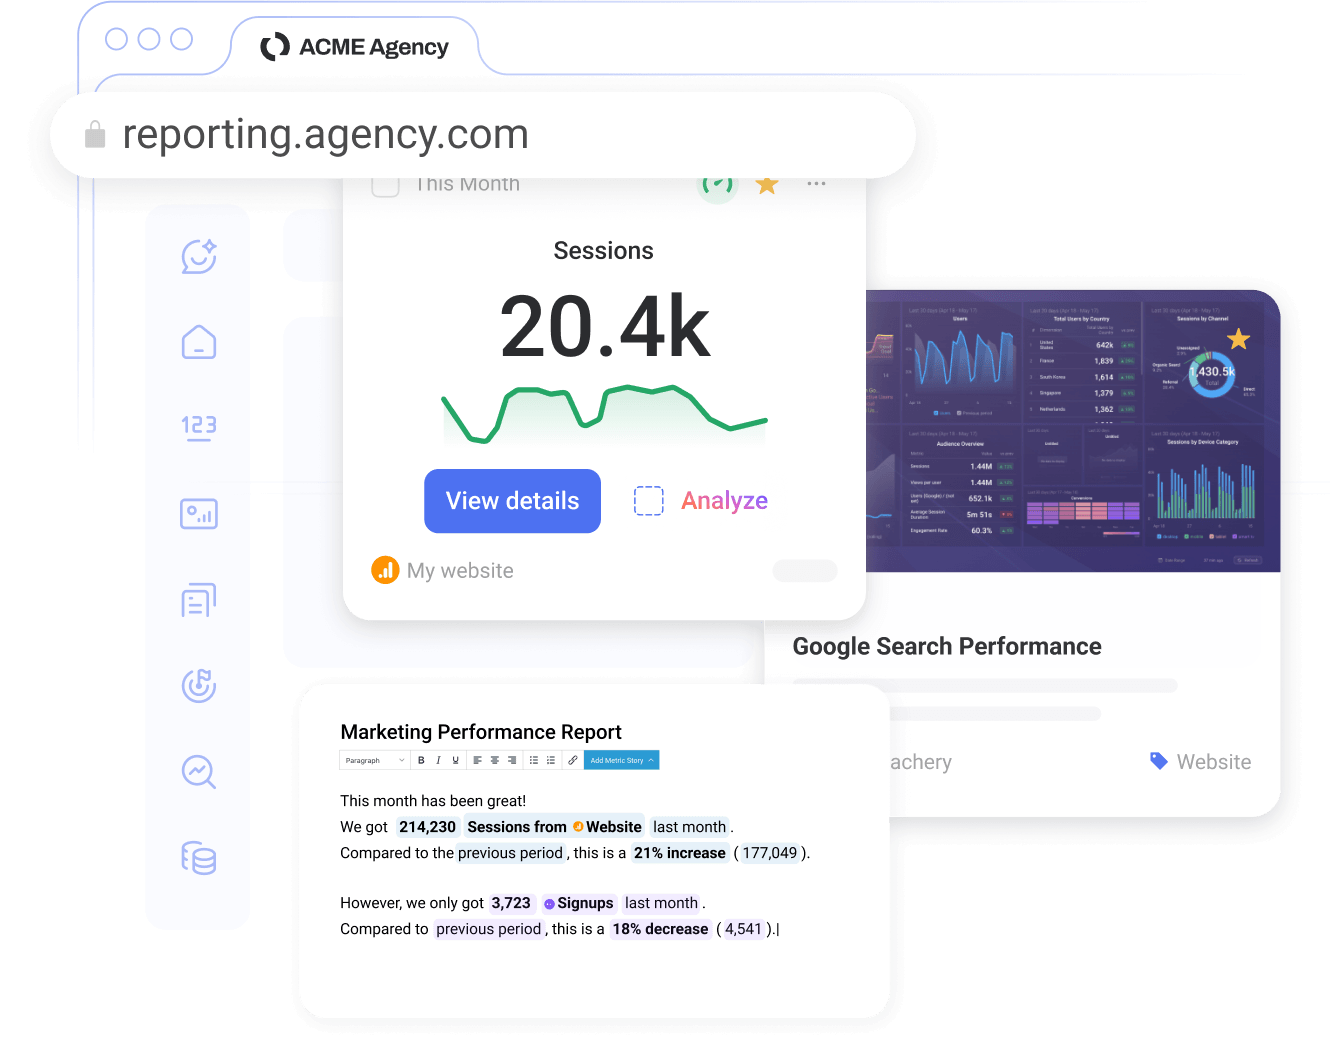
- BI features (limited*) Build up to 1 dashboard or report and 10 custom metrics with access to pre-built metrics, templates, and anomaly detection.
- Datasets Prepare custom tables of raw data from one or more sources. Apply filters and calculate new columns to analyze and visualize your data however you need.
- MCP server & API Connect Databox to AI tools like ChatGPT or Claude to access trusted metrics and trigger actions, and send data from any source using the REST API to build custom integrations and automate metric ingestion.
- Sharing & Notifications Share dashboards and reports via secure links, TV streams, or embeds, and stay on top of performance with Slack updates, scheduled snapshots, scorecards, alerts, and digests.
- 3 / 3 Data sources included / limit
- Cloud integrations
- 11 months Historical data
- daily Max sync frequency
- AI analyst (Genie)
- 50 (fixed) AI credits included / mo
- Performance summaries
- Pre-built metrics and templates
- Anomaly detection
- 1 Dashboards & reports
- 10 Custom metrics
- Goals
- 1 Users
- Two-factor authentication (2FA)
- 1 user Invite team members and control access by assigning roles that define what each person can see and do in Databox.
-
500
AI credits/mo
The number of AI credits available each month to power Genie and the MCP server. Credits are shared across the account and reset monthly.
- All integrations Connect to 130+ cloud tools, spreadsheets, SQL and NoSQL databases, and supported APIs through custom integrations to pull data from virtually any source.
- BI features Build unlimited dashboards, reports, and custom metrics, with access to pre-built metrics, templates, and anomaly detection.
- Datasets Prepare custom tables of raw data from one or more sources. Apply filters and calculate new columns to analyze and visualize your data however you need.
- MCP server & API Connect Databox to AI tools like ChatGPT or Claude to access trusted metrics and trigger actions, and send data from any source using the REST API to build custom integrations and automate metric ingestion.
- Sharing & Notifications Share dashboards and reports via secure links, TV streams, or embeds, and stay on top of performance with Slack updates, scheduled snapshots, scorecards, alerts, and digests.
- 5 / 5 Data sources included / limit
- Cloud integrations
- Spreadsheets, databases, custom integrations
- Datasets
- Databox API
- 24 months Historical data
- hourly Max sync frequency
- AI analyst (Genie)
- 500 AI credits included / mo
- Performance summaries
- MCP server
- Pre-built metrics and templates
- Anomaly detection
- ∞ Dashboards & reports
- ∞ Custom metrics
- Goals
- Add-on Objectives and Key Results (OKRs)
- 1 Users
- Two-factor authentication (2FA)
- Add-on Fiscal calendar
- Add-on White-labeling
- Add-on Advanced security (SSO, audit log, session controls)
- Chat and email support
- Add-on Priority support
- ∞ unlimited users Invite team members and control access by assigning roles that define what each person can see and do in Databox.
-
1,500
AI credits/mo
The number of AI credits available each month to power Genie and the MCP server. Credits are shared across the account and reset monthly.
- All integrations Connect to 130+ cloud tools, spreadsheets, SQL and NoSQL databases, and supported APIs through custom integrations to pull data from virtually any source.
- BI features Build unlimited dashboards, reports, and custom metrics, with access to pre-built metrics, templates, and anomaly detection.
- MCP server & API Connect Databox to AI tools like ChatGPT or Claude to access trusted metrics and trigger actions, and send data from any source using the REST API to build custom integrations and automate metric ingestion.
- Sharing & Notifications Share dashboards and reports via secure links, TV streams, or embeds, and stay on top of performance with Slack updates, scheduled snapshots, scorecards, alerts, and digests.
- Datasets (limited*) Limited to creation from spreadsheets, databases and custom integrations. Dataset modification tools are not included.
- 3 / ∞ Data sources included / limit
- Cloud integrations
- Spreadsheets, databases, custom integrations
- limited* Datasets
- Databox API
- 24 months Historical data
- hourly Max sync frequency
- AI analyst (Genie)
- 1,500 AI credits included / mo
- Performance summaries
- MCP server
- Pre-built metrics and templates
- Anomaly detection
- ∞ Dashboards & reports
- ∞ Custom metrics
- Goals
- Add-on Objectives and Key Results (OKRs)
- Sharing (shareable links, stream to TV, embed)
- Notifications (scorecards, alerts, snapshots, digest)
- CSV export (datasets)
- Slack
- ∞ Users
- Two-factor authentication (2FA)
- Add-on Fiscal calendar
- Add-on White-labeling
- Add-on Advanced security (SSO, audit log, session controls)
- Chat and email support
- Add-on Priority support
- ∞ unlimited users Invite team members and control access by assigning roles that define what each person can see and do in Databox.
-
4,000
AI credits/mo
The number of AI credits available each month to power Genie and the MCP server. Credits are shared across the account and reset monthly.
- Datasets Prepare custom tables of raw data from one or more sources. Apply filters and calculate new columns to analyze and visualize your data however you need.
- 15-min sync* Keep data refreshed every 15 minutes on up to 5 data sources, subject to availability based on each data source's API capabilities.
- Forecasting Forecast the future performance of any metric for the next month, quarter, or year. Model changes to explore scenarios and turn projections into goals with one click.
- Sub-accounts Set up dedicated sub-accounts to streamline and organize your reporting process.
- Dedicated CSM Work with a named Customer Success Manager who knows your account and helps you get the most out of Databox.
- 3 / ∞ Data sources included / limit
- Cloud integrations
- Spreadsheets, databases, custom integrations
- Datasets
- Databox API
- ∞ Historical data
- 15 min* Max sync frequency
- AI analyst (Genie)
- 4,000 AI credits included / mo
- Performance summaries
- MCP server
- Pre-built metrics and templates
- Anomaly detection
- ∞ Dashboards & reports
- ∞ Custom metrics
- Goals
- Objectives and Key Results (OKRs)
- Forecasting
- Sharing (shareable links, stream to TV, embed)
- Notifications (scorecards, alerts, snapshots, digest)
- CSV export (datasets)
- Slack
- ∞ Users
- Two-factor authentication (2FA)
- Fiscal calendar
- Add-on White-labeling
- Add-on Advanced security (SSO, audit log, session controls)
- ∞ Sub-accounts
- Chat and email support
- Dedicated CSM
- Add-on Priority support
- ∞ unlimited users Invite team members and control access by assigning roles that define what each person can see and do in Databox.
-
Flexible AI credits/mo
AI credit allowance is negotiated based on account size and usage needs, so the account is not constrained by a fixed monthly limit.
- White-labeling White label Databox to offer clients your own custom branded reporting solution
- Advanced security Enforce SSO and two-factor authentication across the account, monitor activity with audit logs, and manage active sessions and login records.
- Single sign-on (SSO) Let team members access Databox through the company's existing identity provider, reducing password management overhead and keeping access under centralized IT control.
- Account setup Get hands-on help configuring Databox to match your reporting needs from day one.
- Priority support Skip the queue and have support cases handled ahead of standard requests.
- Custom Data sources included / limit
- Cloud integrations
- Spreadsheets, databases, custom integrations
- Datasets
- Databox API
- ∞ Historical data
- 15 min* Max sync frequency
- AI analyst (Genie)
- Custom AI credits included / mo
- Performance summaries
- MCP server
- Pre-built metrics and templates
- Anomaly detection
- ∞ Dashboards & reports
- ∞ Custom metrics
- Goals
- Objectives and Key Results (OKRs)
- Forecasting
- Sharing (shareable links, stream to TV, embed)
- Notifications (scorecards, alerts, snapshots, digest)
- CSV export (datasets)
- Slack
- ∞ Users
- Two-factor authentication (2FA)
- Fiscal calendar
- White-labeling
- Advanced security (SSO, audit log, session controls)
- ∞ Sub-accounts
- Chat and email support
- Dedicated CSM
- Priority support
- Account setup
- Security & compliance review
Trusted by more than 20,000 companies.
Upgrade Your Experience with Add-Ons
AI credit top-up
AI credits fuel Databox's AI features, including Genie and the MCP server. Actions like generating insights, building dashboards, and asking questions about your data all consume credits from a shared monthly pool.
Branding & white-labeling
Remove Databox branding and replace it with your own logo, colors, and domain so clients experience a fully branded reporting environment. Ideal for agencies and resellers who want to offer analytics as part of their own product or service.
Learn more15 min sync per source
Keep data refreshed every 15 minutes for selected data sources, giving teams access to near real-time performance data throughout the day. Availability varies by data source based on vendor API capabilities and rate limits.
Learn moreFiscal calendar
Align all date ranges and reporting periods to your financial year instead of the standard calendar, so dashboards and metrics reflect how your business actually measures and tracks performance over time.
Learn moreAdvanced security management
Enforce SSO and two-factor authentication across the entire account, monitor user activity through activity logs, and maintain full visibility and control over active sessions and login records to meet internal security policies.
Learn moreOKRs
Define objectives, break them down into key results and sub-goals, and connect them directly to performance data in Databox. Assign ownership to teams or individuals, track progress automatically, and keep every level of the organization aligned around the work that drives results.
Learn moreFull plan comparison
Exclusive benefits for Marketing agencies, RevOps and Consulting businesses
- Save time: Manage unlimited client accounts in one platform, with AI and automations handling the routine work so your team focuses on strategy and client results.
- Own the client experience: White-label Databox so every dashboard and report a client sees is fully branded as your agency (available as an add-on).
- Grow your revenue: Join our Solutions Partner Program to learn how to position, package, and sell BI as a Service.
-
GDPR
compliant -
 SOC 2
SOC 2
certified
Trusted by 20,000+ growing businesses

Frequently asked questions
Which Databox plan is right for me?
The right Databox plan depends on how much data you need to connect, how many people need access, and which analytics capabilities your team needs.
The Free plan is best for getting started with basic KPI visibility. You get 3 data sources, 1 dashboard, and 10 custom metrics.
The Analyst plan is best for individual operators who want a personal analytics workspace. You get 5 data sources, unlimited dashboards and reports, datasets, and 500 AI credits a month.
The Pro plan is for teams that have outgrown spreadsheets and screenshots. You get unlimited users, unlimited dashboards and reports, hourly sync, 1,500 AI credits a month, and the sharing and notification tools to keep everyone working from the same numbers.
The Growth plan is best for teams that need deeper analysis and planning. You get everything in Pro plus datasets for preparing and modeling your own data, forecasting to project where metrics are heading, sub-accounts for managing multiple business locations, 15-minute sync, 4,000 AI credits a month, and a dedicated customer success manager.
The Custom plan is best for organizations with enterprise requirements. You get white-labeling, SSO, advanced security, account setup, priority support, and flexible AI credits sized to your usage.
Does Databox charge per user?
No. Unlike BI tools that charge per seat, Databox includes unlimited users on Pro, Growth, and Custom. Everyone who needs to see the numbers can see them, whether that’s your team, your leadership, or your clients.
The Free and Analyst plans are single-user plans built for individual analysis.
Do you offer a free plan?
Yes. The Free plan is built for individuals who want to track key metrics without a financial commitment. You get 3 data sources, 1 dashboard, 10 custom metrics, and 50 AI credits. Paid plans unlock more data sources, users, unlimited dashboards and reports, datasets, forecasting, and more AI credits to power our AI Analyst and the MCP server.
Will Databox scale as my team grows?
Yes. Most teams grow in two directions: more people who need access, and more sophistication in how they use data. Databox is built for both. Unlimited users on Pro, Growth, and Custom means headcount never drives your bill, and moving up the plan ladder unlocks the depth: more AI credits, faster sync, datasets, forecasting, sub-accounts, advanced security, and priority support.
What counts as a data source in Databox pricing?
A data source is a specific dataset, account, property, or view that you use in Databox. A connection is the integration or authentication layer used to bring data from a service such as Google Analytics, HubSpot, Salesforce, or another tool.
One connection can include multiple data sources. For example, one Google Analytics connection can include multiple website properties as separate data sources.
Can I add more data sources without upgrading?
Yes. On Pro, Growth, and Custom, you can add data sources to your plan at any time for $5.60 per source per month on annual billing. That way, connecting a new client, a new GA4 property, or a new ad account doesn’t force a plan change. Free and Analyst include a fixed number of sources (3 and 5) and require a plan upgrade to add more.
How do AI credits and AI features work in Databox pricing?
AI credits are how Databox prices AI usage. Every question you ask Genie, every AI-generated insight, every dashboard built with AI, and every MCP query draws from a monthly credit pool that resets at the start of each month.
The right credit allocation depends on how heavily your team uses AI. Free includes 50 credits for light exploration, Analyst includes 500 for solo analysis work, Pro includes 1,500 for team-wide AI use, Growth includes 4,000 for teams running AI-assisted reporting at scale, and Custom offers flexible limits sized to your usage.
What is the difference between Databox Business and Agency pricing?
Both plan types run on the same Databox platform. The difference is what each is built around.
Business plans are built around one company’s performance: connect your tools, track your KPIs, share dashboards with your team, and run goals and forecasts against your own data.
Agency plans are built around managing performance for many clients: sub-accounts to separate each client’s data, white-labeling to make every dashboard and report your own, and pricing that scales with the number of clients you work with.
Can Databox replace or complement tools like Looker Studio, Power BI, or Tableau?
Yes. Most teams use Databox in one of two ways.
If you don’t have a BI tool today, Databox replaces the spreadsheets, screenshots, and one-off dashboards you’ve been stitching together. You get connected data, automated reports, and AI answers in one place that anyone on the team can use.
If you already use Power BI, Tableau, or Looker Studio, Databox sits alongside them. Those tools serve your analysts. Databox serves everyone else with self-serve KPI tracking, scorecards, alerts, automated reporting, and AI-powered summaries built for business teams.
Do I need a data warehouse or ETL tool to use Databox?
No. Databox works with or without a data warehouse.
Most teams connect Databox directly to the tools they already use: 130+ native integrations across CRMs, marketing platforms, ad networks, spreadsheets, databases, and warehouses.
For teams that do have raw data they want to prepare, datasets handle the prep inside Databox. Clean, merge, filter, and standardize your data, then use it in dashboards, reports, metrics, and AI analysis.
Do I need a credit card to start a trial?
No. You can start your 14-day free trial without entering payment details. If you decide to upgrade during your trial, you can add your billing information or credit card details and choose any paid plan. Your first payment is processed only after the 14-day trial ends.
What happens after my free trial?
If no payment details are added by the end of your 14-day trial, your data will stop syncing and scheduled reports and notifications will be paused. To avoid disruption, you can upgrade to a paid plan before your trial ends.
Can I upgrade, downgrade, or cancel at any time?
Yes. You can upgrade, downgrade, or cancel at any time.
Upgrades and downgrades take effect immediately, with any difference handled as a prorated charge or credit. Cancellations take effect at the end of your current billing cycle. If you’re on a monthly plan, that means the end of the month. If you’re on quarterly or annual billing, it means the end of the period you’ve already paid for.
What if I exceed my plan's limits?
Databox notifies you in the app when you reach or exceed limits in your plan. Common limits include the number of data sources, AI credits, sync frequency, dashboards, reports, or access to advanced features that are not included in your current plan.
Depending on the limit, you may be able to add more capacity, upgrade your plan, or adjust your usage.
Do you offer a yearly discount?
Yes. Databox offers a 20% discount when you choose annual billing.
Which payment methods do you accept?
You can pay for your Databox subscription using Visa, Mastercard, Maestro, American Express, JCB, Discover, Diners Club, UnionPay, and Google Pay.
Annual subscriptions may also be billed using other payment methods, such as wire transfer or check. Contact us for more information.
What currency is used for billing?
All Databox prices are listed in US dollars, USD.
What support resources are available to me?
Every Databox customer can access our self-service resources: the Help Center, API documentation, product updates, and the Databox Academy for courses and certifications.
From there, support grows with your plan:
- Chat and email support: included on Analyst, Pro, Growth, and Custom
- Dedicated customer success manager: included on Growth and Custom
- Priority support, account setup, and security and compliance review: included on Custom
Priority support is also available as an add-on on Analyst, Pro, and Growth if you want faster response times.
How do you protect privacy and ensure security?
Databox takes data security and privacy seriously. Databox is SOC 2 certified and uses trusted hosting infrastructure, security controls, and compliance practices designed to protect customer data.
Databox also provides security and compliance resources to help customers understand how their data is protected, including information about infrastructure, access controls, privacy practices, and compliance standards.
For more information, visit the Databox Security and Compliance page.


compliant
certified