Databox Datasets – Data Preparation
Prepare tables or raw data for analysis, without the learning curve
Standardize, merge, and filter your data into one clean table, so your team can analyze performance with more confidence and take action faster. Built for fast moving teams, not BI experts.
Trusted by 20,000+ growing businesses


Build reliable metrics from a curated source of truth
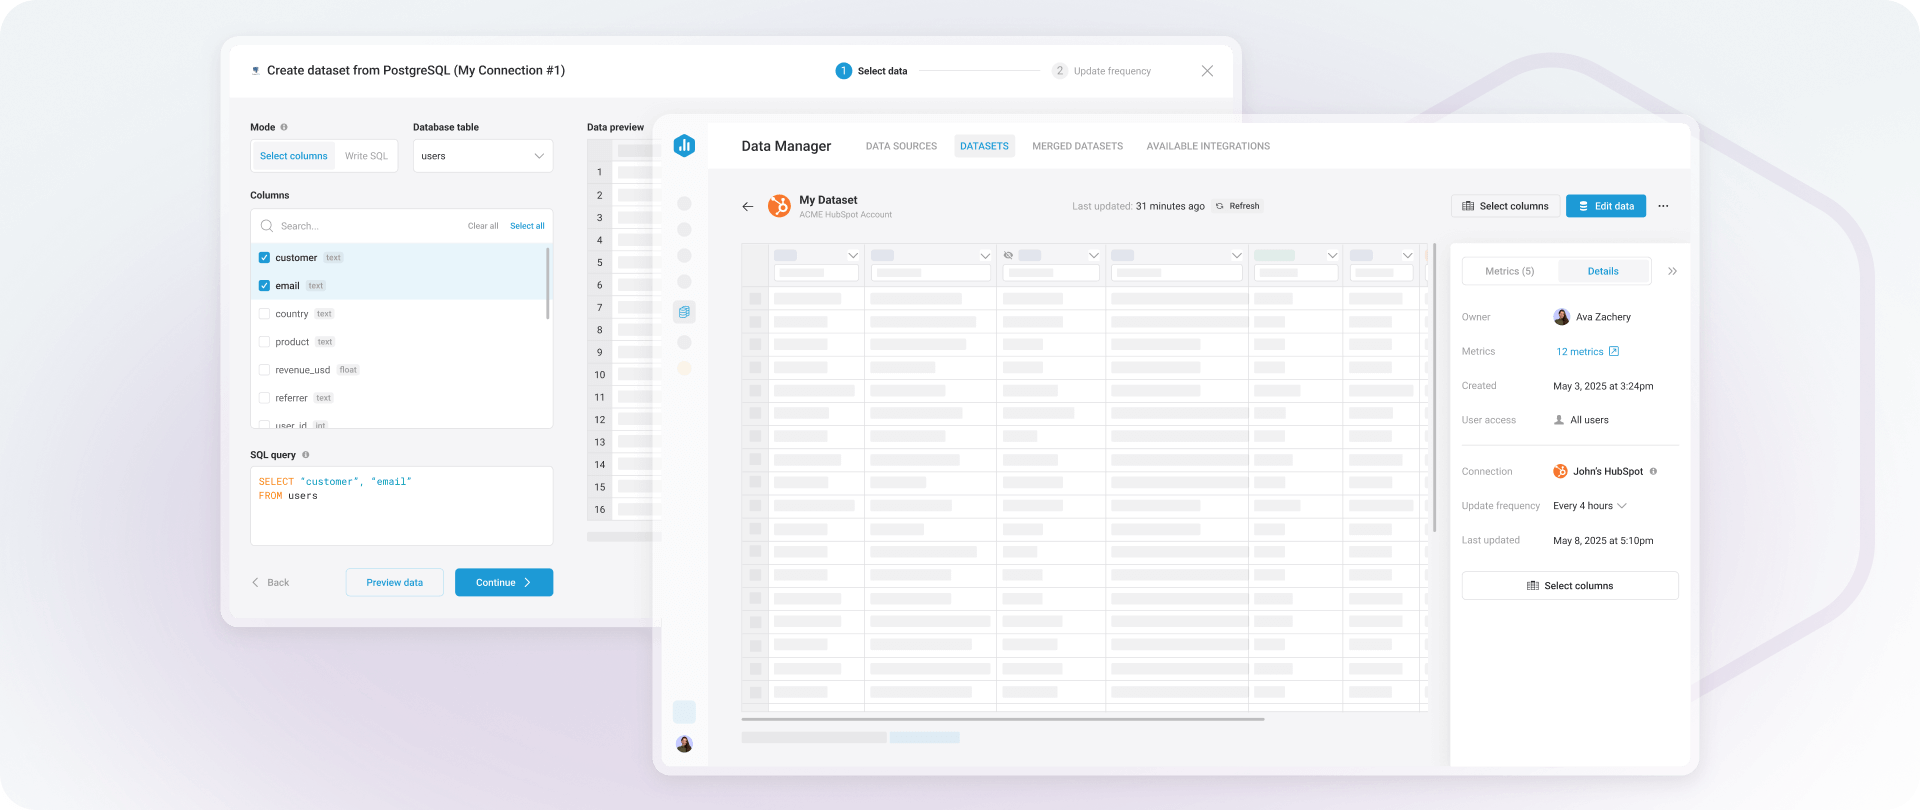
Build custom tables of raw data, without the BI overhead
Pull the exact data you need from spreadsheets, databases, or your connected tools, and turn it into one clean table with a no-code interface built for speed.
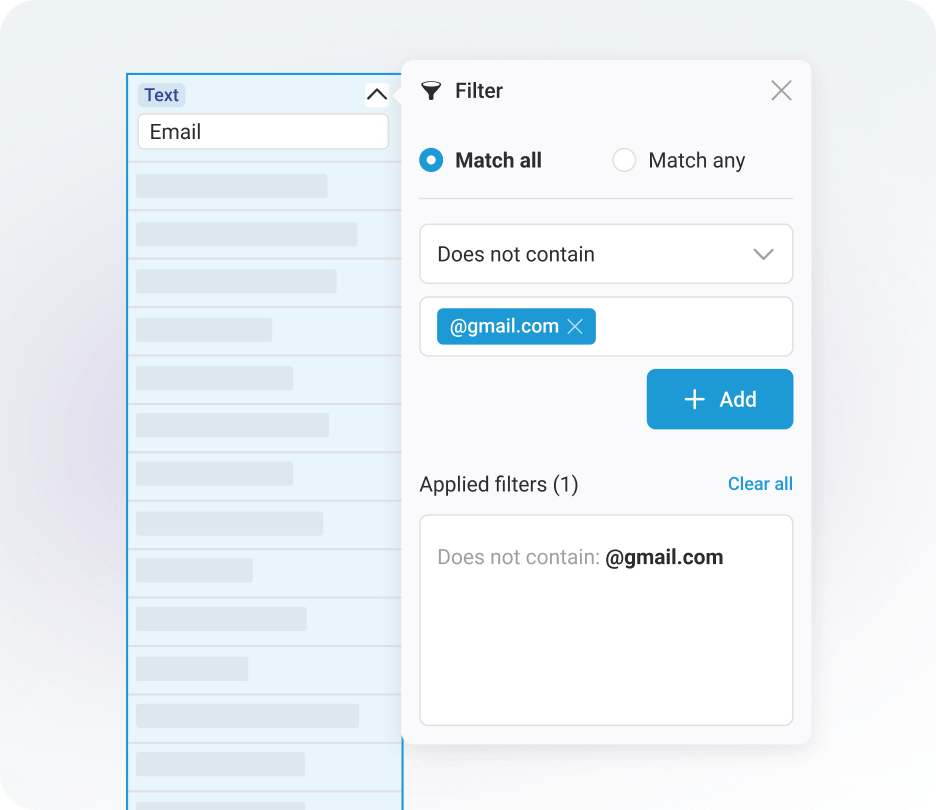
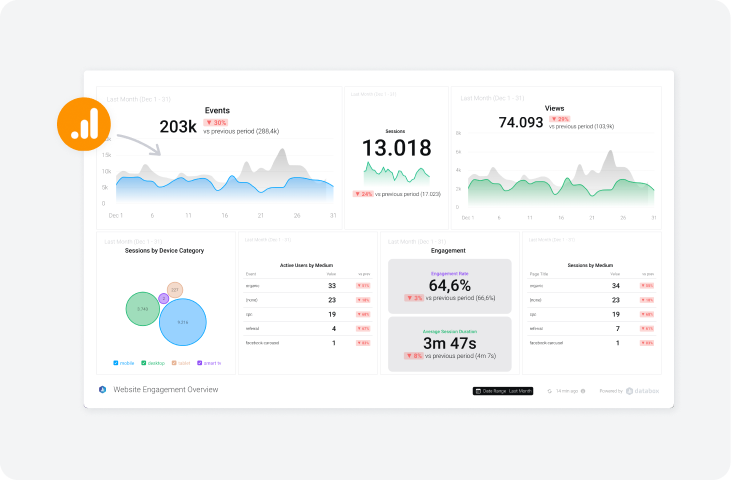
Filter your data to focus on what matters
Apply filters to focus your analysis on the data that matters. Build more reliable metrics and make faster, more confident decisions.
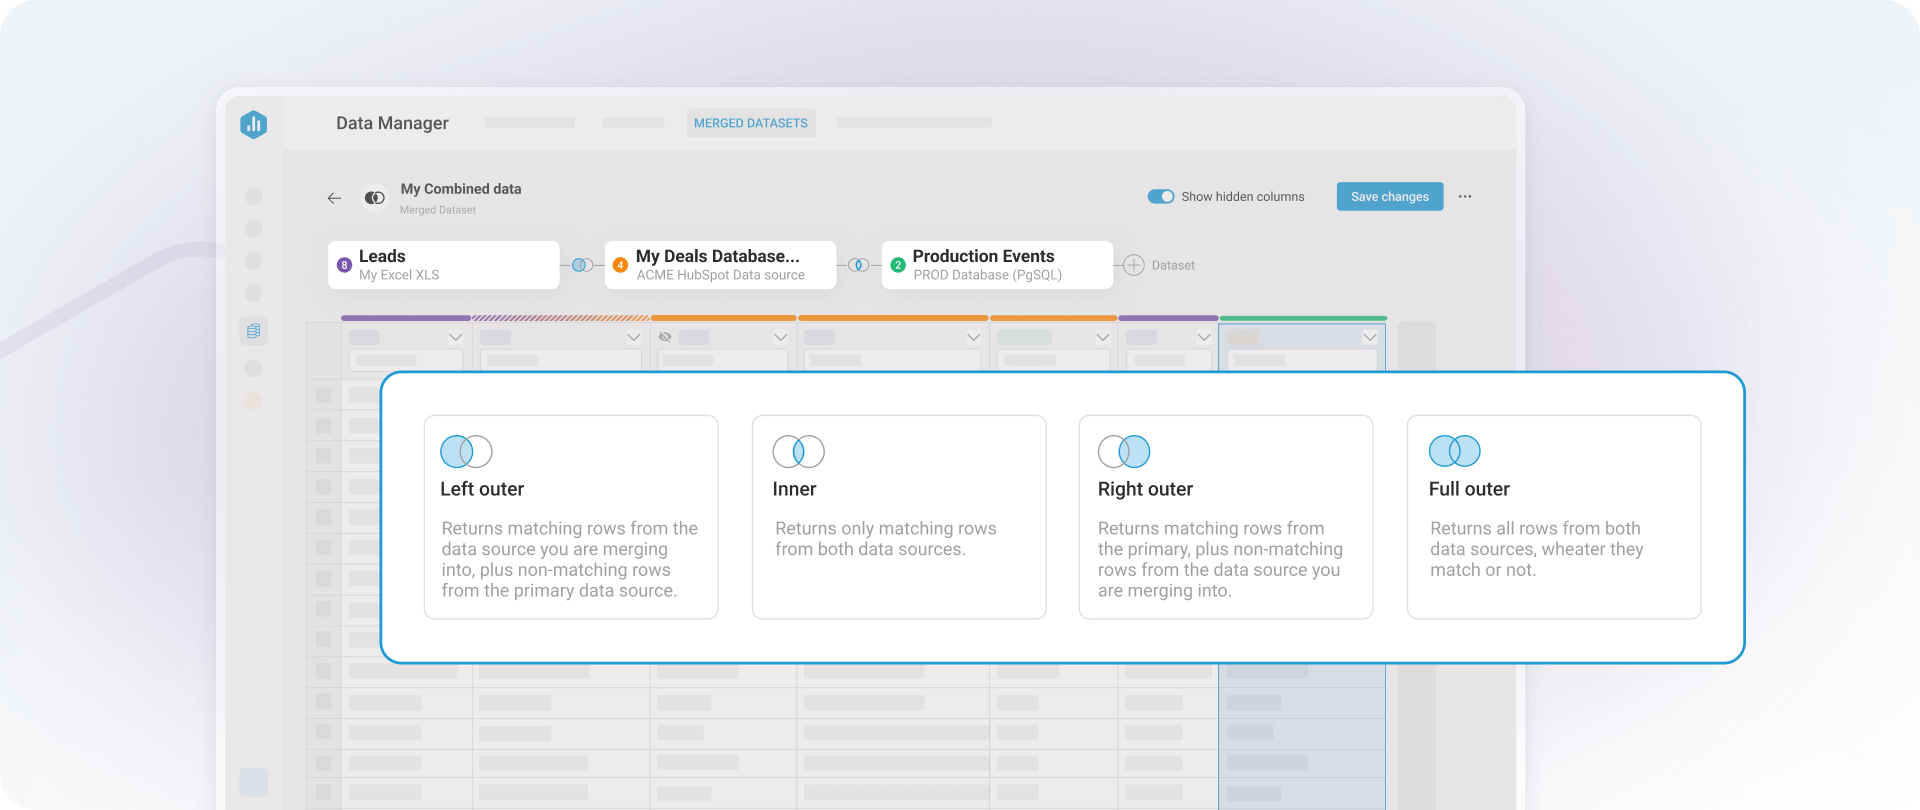
Merge datasets to get the full context
Merge raw data from multiple sources into a single table, so you can analyze the same row-level data side-by-side. Get BI-level insights, without the hassle.
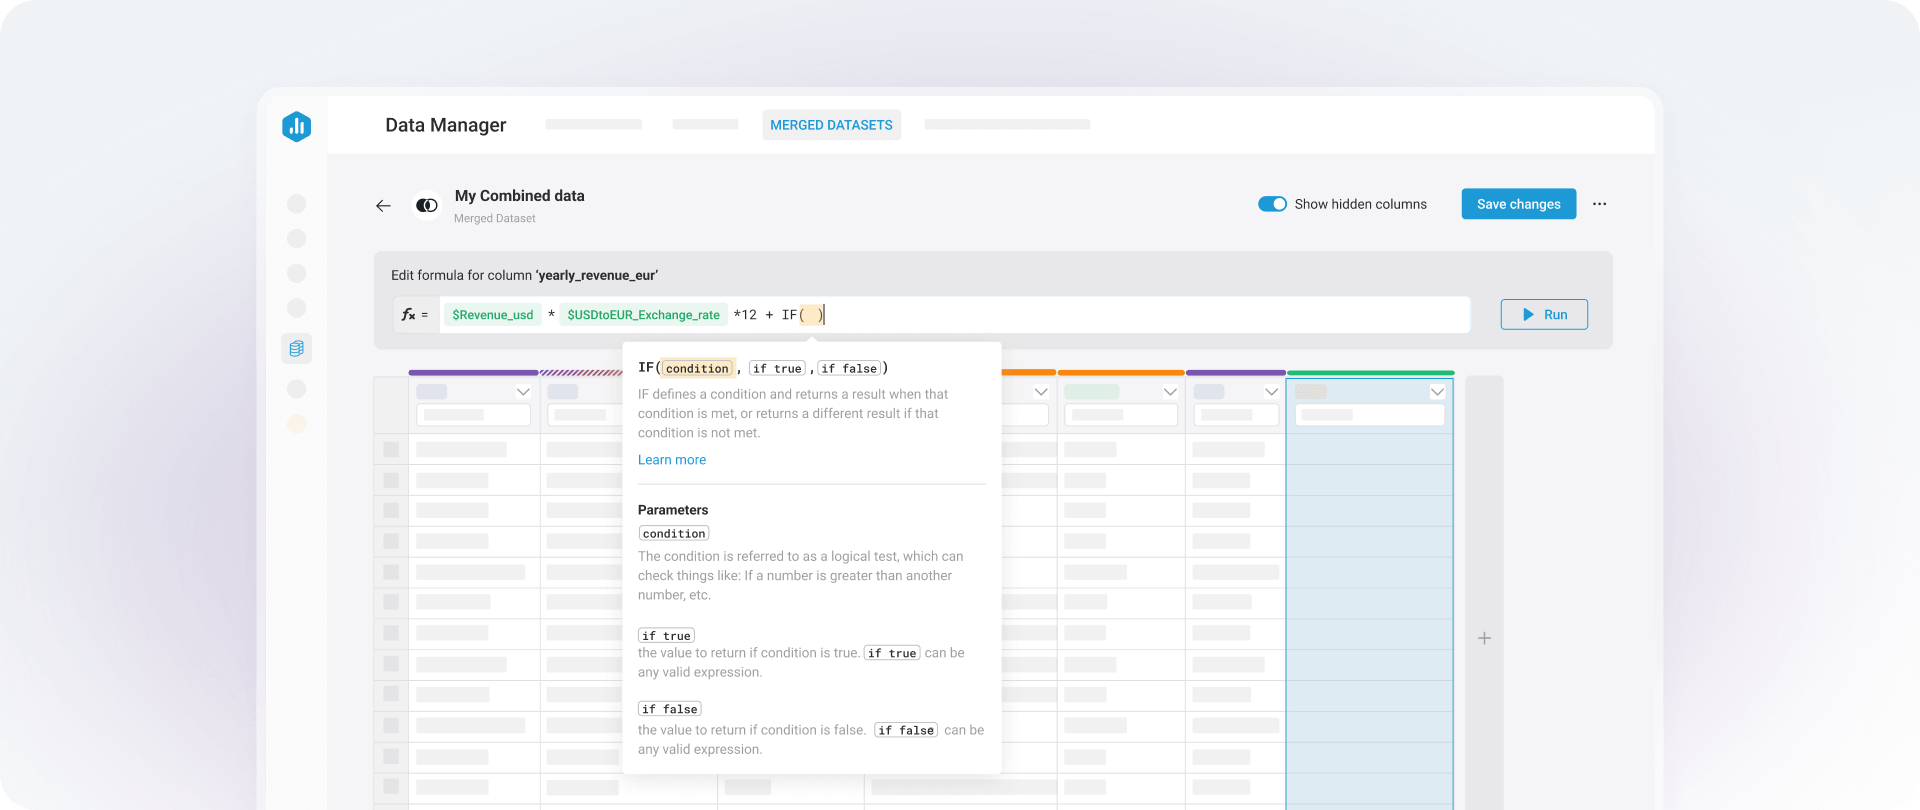
Create New Columns (and Metrics) on the Fly
Calculate columns together to create an entirely new one, then build a custom metric from that column later.
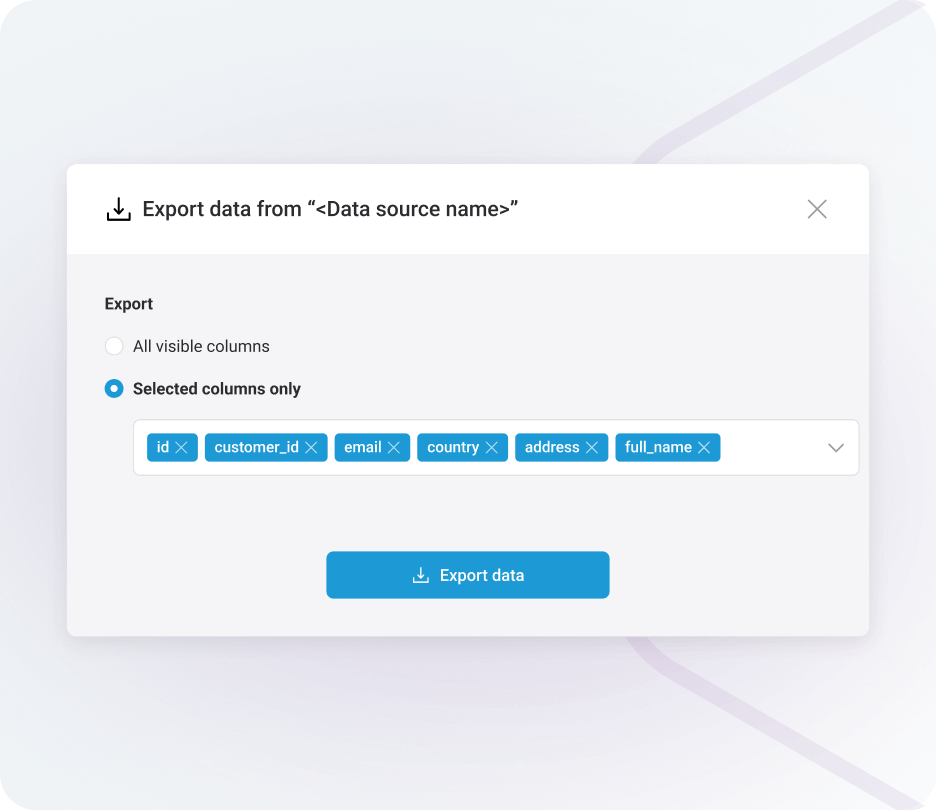
Prepare your data once, analyze it anywhere
Prepare your data in Databox, export it as a CSV file, and use it with other tools.
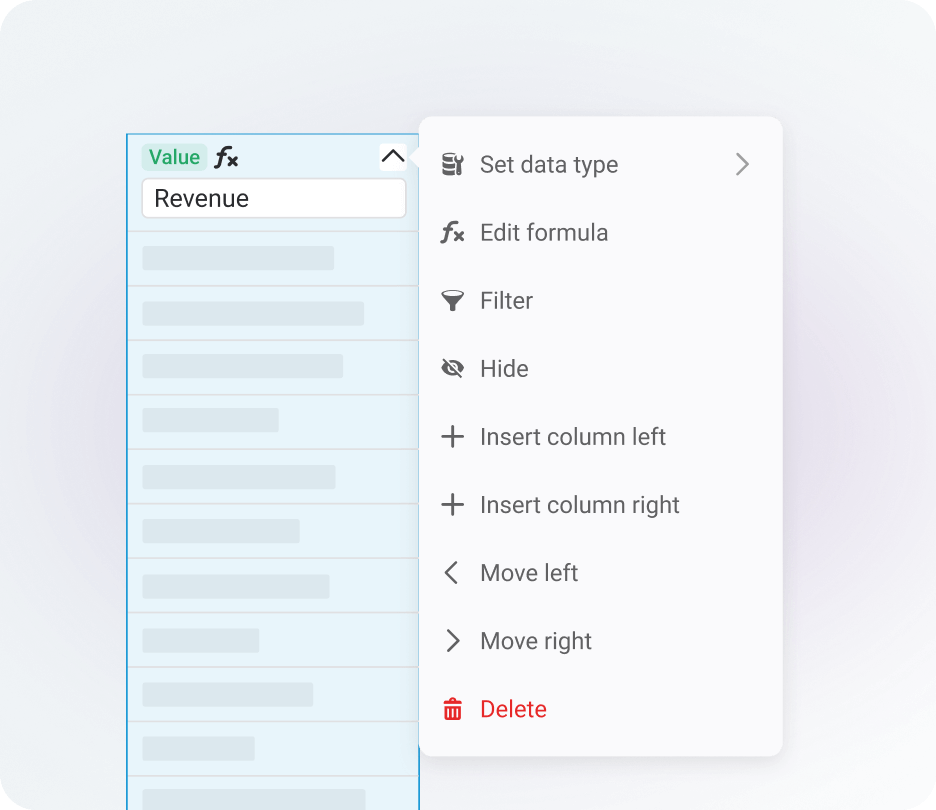
Curate data your way
Rename columns, change field types, or hide irrelevant ones to make your insights easier to understand for clients, execs, and your team.
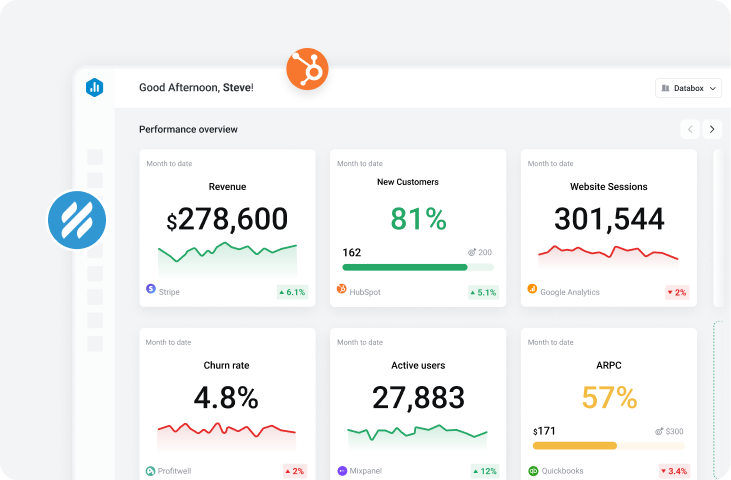
Prepare your data once, use it everywhere
Build metrics from clean, structured datasets, and reuse them across dashboards, reports, goals, forecasts and more!
Powerful or and accessible
We took the best tools normally found in complicated enterprise analytics platforms, and made them accessible and easy to use for growing businesses
Why Choose DataboxCustomer stories
Learn how other growing businesses are using dashboards to inform decisions, create plans, and drive growth.


compliant
certified