Content Marketing

Free Content Marketing Dashboard Templates

These content marketing dashboards come pre-built with some of the most commonly tracked content marketing metrics from the most popular tools. You can also customize your templates later. To get started, just choose a template, connect your data, and your metric visualizations will populate automatically.

Create your free Databox account

Track some of the most common Content Marketing metrics and KPIs and analyze your Content Marketing performance with just a few clicks.

TOP Content Marketing INTEGRATIONS
  • AccuRanker
  • Instagram Business
  • Google Analytics 4
  • Facebook Groups
  • Google Search Console
Don’t see your SEO tool?
You can build a dashboard with any data using Zapier, Integromat, Google Sheets, or a SQL database.
Google Analytics dashboard template which will give you insights about your users, sessions, referrals and more.
Google Universal Analytics
Facebook dashboard template provides you with insights about page views, likes post reach which will help you to know more about page followers.
Facebook Pages
Focus in on the metrics that matter from your Google Analytics account. Measure the key outcomes that your website was designed to create, as well as the leading indicators that help pinpoint where your greatest opportunities lie.
Google Universal Analytics
Instagram dashboard template provides you with insights about your overall account health and performance and will help you to know more about your Instagram followers.
Instagram Business
LinkedIn Company pages dashboard template provides you with insights about followers growth, reach, engagement and more.
LinkedIn Company Pages
Google Analytics (Acquisition) dashboard template goes deeper into your Sources and reveals which marketing campaigns have been most productive.
Google Universal Analytics
HubSpot Marketing dashboard template provides you with insights to increase traffic, convert leads, and prove ROI.
HubSpot Marketing
Download this free dashboard to measure the overall engagement of your website and app visitors. Get insights into how visitors interact with your most important pages, which actions are they taking, how much of their time they're giving you and more
Google Analytics 4
The Google Analytics SEO dashboard shows exactly which search terms lead to visitors, and the quality of those visitors.
Google Universal Analytics Google Search Console
The Twitter dashboard template shows how your followers engage with your Tweets. It will track growth in likes, comments, follows, mentions and retweets.
Twitter
Facebook Pages dashboard template helps you understand how people learn about your brand on Facebook. It also showcases your top-performing posts.
Facebook Pages
The Search Console Basics dashboard reveals which pages are most visible on SERPs and which ones actually drive organic traffic.
Google Search Console
The Google Analytics Traffic Growth dashboard slices your traffic different ways to determine factors that lead to quality visits.
Google Universal Analytics
This Dashboard gives a clear overview of your Reach, Campaign Performance and Community Activity based on Facebook Pages and Facebook Ads metrics.
Facebook Ads Facebook Pages
The Youtube Overview Dashboard shows engagement on your Youtube channel with metrics like minutes, views and referral sources.
YouTube
This template looks at the actions and performance of your posts. It will help you or your team focus on what matters - engaging more followers.
Instagram Business
This dashboard highlights the second part of the inbound funnel- Convert. It shows how well you are creating leads from your site.
Google Universal Analytics HubSpot Marketing
The Google Analytics Content Analysis dashboard reveals which pages keep your visitor's attention and prevent them from bouncing.
Google Universal Analytics
Download this free Google Analytics 4 Acquisitions dashboard template to dig deeper into your traffic sources, monitor user behavior, and keep an eye on how it all impacts your revenue.
Google Analytics 4
The YouTube Channel Performance dashboard makes it easy to measure video engagement with multiple metrics.
YouTube
The Google Analytics Social Media dashboard looks at the actions that users take after learning about your brand on social media.
Google Universal Analytics
The Blog Quality Metrics Dashboard shows you which posts engage readers and encourage them to take further action on your site.
Google Universal Analytics
HubSpot (Leads by Source) dashboard template gives insights on which sources of traffic drive the most leads or contacts. It explains where to focus marketing effort.
HubSpot Marketing
The Social Networks dashboard template integrates Facebook, Twitter, Linkedin and Instagram data. It shows daily traffic across the 4 networks and tracks follower counts..
Facebook Pages Instagram Business LinkedIn Company Pages Twitter
This template will give you insights about your audience and followers growth. It will help you to understand your user base and drive ideas about post strategies.
Instagram Business
Track and visualize important search ranking factors like your backlink profile, domain rank, referring domains, and more.
Ahrefs
Linkedin Demographics dashboard template looks at the followers on your company's Linkedin. It lets you know what industries and roles have enjoyed your marketing message.
LinkedIn Company Pages
Content Marketing Drilldown. View metrics: pageviews, website goal completion rate, page drilldown
Google Universal Analytics
The Monthly Marketing dashboard template examines Google Analytics and HubSpot Marketing for a complete view of traffic and user acquisition.
Google Universal Analytics HubSpot Marketing
This dashboard will help you track all stages of the inbound marketing funnel based on the source of traffic.
HubSpot Marketing
Facebook Pages: followers by city, followers by age group, Post impressions, clicks, likes, comments, video views
Facebook Pages
This Google Analytics Acquisition dashboard goes deep into the channels, referrers, and pages that drive traffic and conversions on your website.
Google Universal Analytics
Facebook Pages: page impressions, Page Engagements, Page Overview, Post Overview, Followers by gender
Facebook Pages
Instagram Business: new posts, profile clicks, followers by age group, new posts by media type, all time top posts performance, new posts performance
Instagram Business
Content Marketing Overview. View metrics: sessions, sessions by channel, events by event action, audience behavior, pageviews, goal completions by goal
Google Universal Analytics
Instagram Business: impressions, new followers, new posts, following vs followers, activity overview
Instagram Business
The HubSpot Landing Pages dashboard allows you to discover your top-performing pages through every step of the funnel.
HubSpot Marketing
Audience Overview. View metrics: sessions by channel, sessions by device, source drilldown, country drilldown, users by gender, new users by referrer
Google Universal Analytics
The Organic Blog Traffic dashboard lets you review the blog posts that generated the most search traffic in the last month.
Google Universal Analytics
The Hubspot Blogging dashboard template looks at your most highly-trafficked blog posts each month. It measures whether you are hitting monthly goals.
HubSpot Marketing
The Google Analytics website engagement dashboard provides deeper insights into bounce rate, session duration, time on page, and more.
Google Universal Analytics
LinkedIn Company Pages: post drilldown, post impressions, shares, updates, clicks, likes, comments
LinkedIn Company Pages
This dashboard, authored by ConnectEngine, is a guide to getting started with Facebook Video and understanding when people watch, and when they stop watching as well.
Facebook Pages
LinkedIn Company Pages: total followers, page updates, impressions, likes, engagement overview
LinkedIn Company Pages
This dashboard reviews your inbound and PPC tactics for filling your marketing funnel.
HubSpot Marketing Google Ads
This template will enable you gain valuable insights about the growth of your group’s members.
Facebook Groups
This dashboard helps you monitor the YouTube videos that drive the most views and watch time.
YouTube
Instagram Business: new followers, followers by gender, followers by age group, followers by city, followers by country, profile clicks
Instagram Business
This template uses Google Analytics to dive deeper into your traffic segments to identify where quality visitors are coming from.
Google Universal Analytics
LinkedIn Company Pages: new followers, followers industry, followers by location, followers department, followers seniority
LinkedIn Company Pages
The YouTube Watch Time Analysis dashboard helps you monitor watch time across all your videos and get alerts on changes.
YouTube
This dashboard helps you track traffic sources, monitor audience behavior, and add performance-focused notes to Google Analytics data.
Google Universal Analytics
This Google Analytics Databoard shows your overall traffic, users, pages sessions and bounce rate. This offers a list of top performing landing pages, sessions, top channels and rate of goal completions from Google Analytics.
Google Universal Analytics
Twitter: new tweets engagement, tweets by likes, tweets by retweets, following to followers ratio, recent followers
Twitter
The Vimeo Basics dashboard gives you a high-level overview of video engagement across your account.
Vimeo
The HubSpot Email Performance dashboard template gives you all your metrics on email success in one place. It also looks at historical data to track improvements over time.
HubSpot Marketing
HubSpot Marketing Performance Overview: sessions, visitors, bounce rate, new contacts, new customers, by source, new opportunities
HubSpot Marketing
Quickly measure your awareness performance in Google Analytics, Google Organic Search and Facebook with this dashboard.
Google Universal Analytics Facebook Pages Google Search Console
YouTube: traffic source views, traffic source watch time, views by device, watch time by device, performance by video
YouTube
Social Media dashboard template shows activity across your 4 favorite social networks. It focuses on visitor and follower counts over various time periods.
HubSpot Marketing Facebook Pages Instagram Business LinkedIn Company Pages Twitter
HubSpot Marketing Website Overview: sessions, bounce rate, page views, new vs returning visitors, session quality, cta engagement
HubSpot Marketing
This dashboard gives you three key pieces of data that will help you improve the content on your site: your highest converting pages, your most-clicked keywords, and your CTRs by keyword.
Google Universal Analytics Google Search Console
YouTube: views, watch time, subscribers, subscribers gained, subscribers lost, engagement overview
YouTube
This dashboard measures the watch time performance trends by device for YouTube channel.
YouTube
This dashboard pulls in metrics from HubSpot Mktg and Google Analytics to give a high level overview of how your website is performing.
Google Universal Analytics HubSpot Marketing
This dashboard helps you monitor the performance—organic search traffic, Google Search rankings, CTRs, and conversions—of old blog posts you've recently updated
Google Universal Analytics Google Search Console
This dashboard helps you quickly identify old blog posts you need to update by showing you which posts are losing organic search traffic and Google Search rankings.
Google Universal Analytics Google Search Console
This dashboard gives you an overview of three categories of KPIs from Google Analytics: Acquisition, Behavior, Conversion.
Google Universal Analytics
The Google Analytics Responsive Design dashboard measures the user experience of each page on your site on tablet and mobile.
Google Universal Analytics
Hubspot Landing Page Performance dashboard template shows activity across your landing pages, and their activity over the last 30 days, previous month and past year.
HubSpot Marketing
This dashboard allows you to track data from multiple YouTube channels in one place.
YouTube
Wistia’s dashboard template provides you with video analytics about plays, loads and visitors and to shows you the story behind each view.
Wistia
The HubSpot Social Media template examines how many customers originated from each social media sources. It monitors day-by-day visits from social media networks as well.
HubSpot Marketing
The Visits by Source dashboard template shows the origin of your site or app traffic. You can examine which marketing efforts have captured an audience.
HubSpot Marketing
Facebook Pages, Instagram Business, Linkedin Company Pages, Twitter overview
Facebook Pages Instagram Business LinkedIn Company Pages Twitter YouTube
The Referral Overview dashboard shows which external sites drive traffic, and which ones drive conversion on your site.
Google Universal Analytics
This HubSpot Marketing Template drills down into your Website Sessions so you can better determine the effectiveness of your blogging efforts. I uses a combination of quality and quantity Metrics to help you understand your audience's behavior.
HubSpot Marketing
This SLA-inspired template will give you an overall snapshot of team performance for Sales & Marketing. Track lifecycle stage conversion rates along with Marketing & Sales team activities within the HubSpot Marketing & HubSpot CRM systems.
HubSpot Marketing HubSpot CRM
This dashboard gives the user a month-to-date view of their content marketing performance using data from HubSpot Marketing and Google Analytics.
Google Universal Analytics HubSpot Marketing
This template gives you an overview of all your top email marketing metrics in HubSpot.
HubSpot Marketing
HubSpot Marketing Landing Page Overview: landing page views, landing page submissions, views by landing page, view to submission conv. rate
HubSpot Marketing
HubSpot Marketing Website Source Drilldown: website benchmarks, sessions, bounce rate, new visitors sessions, new contacts
HubSpot Marketing
This dashboard looks at your most highly-trafficked blog posts each month.
HubSpot Marketing
This dashboard shows all the key performance indicators your business needs to view on a monthly basis from HubSpot Marketing.
HubSpot Marketing
This dashboard allows you to easily view metrics around how you're attracting, converting and closing business, in order to determine how to further pinpoint opportunities for improvement.
Google Universal Analytics HubSpot Marketing
HubSpot Marketing Landing Page Drilldown: page views, cta views, submissions, contact, customers, bounce rate, entrances, exits
HubSpot Marketing
HubSpot Marketing Blog Overview: new blog posts published, blog views, total blog subscribers, new blog subscribers
HubSpot Marketing
This template shows an overview of last month's HubSpot Marketing performance compared to the previous year.
HubSpot Marketing
The Review Site Referrals dashboard monitors which review sites encourage prospects to try your product.
Google Universal Analytics
This dashboard gives you insight as to what sources lead to the most customers. With that information, you can adjust your marketing strategy accordingly.
HubSpot Marketing
Get a detailed overview on the performance of your projects and indivusual videos.
Wistia
Email performance overview out of HubSpot
HubSpot Marketing
This dashboard shows you the flow of contacts through the marketing funnel.
HubSpot Marketing
This dashboard gives an overview of the annual metrics from your HubSpot account, including sales, email, traffic and contacts.
HubSpot Marketing HubSpot CRM
This dashboard shows both internal Wistia and Google Analytics metrics to reveal the impact of video on site behavior.
Google Universal Analytics Wistia
HubSpot Marketing Blog Drilldown: blog post performance, pageviews, cta clicks, ctr, bounce rate
HubSpot Marketing
The Blog Traffic Distribution dashboard helps you find your top performing blog articles based on organic traffic.
Google Universal Analytics SEMrush
This dashboard gives an overview of user acquisition and behavior on your website based on Google Analytics data.
Google Universal Analytics HubSpot Marketing
This dashboard gives an overview of blog health, including views, clicks and average time on page.
Google Universal Analytics HubSpot Marketing
This dashboard shows a high-level report of impact of your traffic generation efforts. See the total vs. new visitors to your site, as well as their corresponding source attribution.
Google Universal Analytics HubSpot Marketing
This template helps you track key Inbound Marketing performance metrics like traffic performance by source, contacts by lifecycle stages, email performance, landing page performance and blog performance.
HubSpot Marketing
This dashboard gives you a overview of your SEO performance against your competitors. In order to see your competitor data you'll need to add them in the connect process.
Moz
Use this free dashboard template to track how awareness video is leading to branded and high-intent searches, track your Facebook ads and Google Ads performance and return on your ad spend.
Google Universal Analytics Facebook Ads Facebook Pages Google Ads
This dashboard, authored by ConnectEngine, is a beginner's guide to getting started with measuring video marketing performance.
Wistia
This template is perfect for clients who want a general overview of their social media performance without getting into too much detail. This will summarize how their brand is doing within the social community.
Facebook Pages LinkedIn Company Pages Twitter Wistia
This dashboard gives you the ability to analyze how email events are performing in order to progress users through the lifecycle stages.
HubSpot Marketing Seventh Sense
The Vimeo Account Overview dashboard offers insights into your visits, views and finances
Vimeo OTT
This dashboard focuses on "Share of Voice", or how you compete with competitors over popular keywords.
AccuRanker
This template moves you through the Attract stage by showing your social media follows and reach, blog view performance, and overall visibility trends.
Google Universal Analytics HubSpot Marketing Facebook Pages Instagram Business LinkedIn Company Pages Twitter SEMrush
The Vimeo OTT Traffic Overview dashboard slices your traffic different ways to determine filters that lead to quality visits.
Vimeo OTT
The Vimeo OTT video overview dashboard makes it easy to measure video efficiency with multiple metrics.
Vimeo OTT

Build custom Content Marketing dashboards

No design or coding skills necessary.

Learn more about Dashboard Designer

What is a Content Marketing Dashboard?

A content marketing dashboard displays all of the key parts of a content marketing campaign in one place and provides quick insights into how well your content marketing strategies are working.

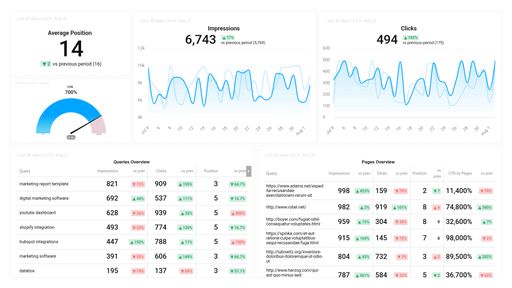
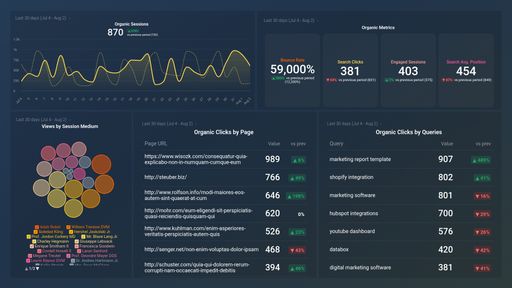
With the help of a content marketing dashboard, content marketing teams are able to discover their highest converting pages, most-clicked keywords, and more, and ultimately prove content marketing ROI.

What Should Be Included in a Content Marketing Dashboard?

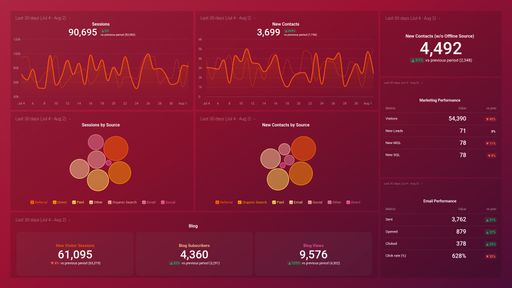
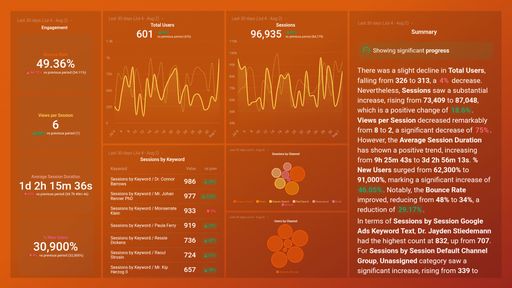
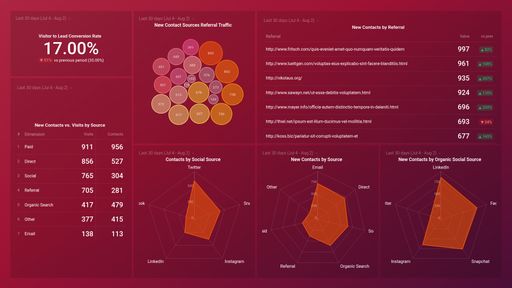
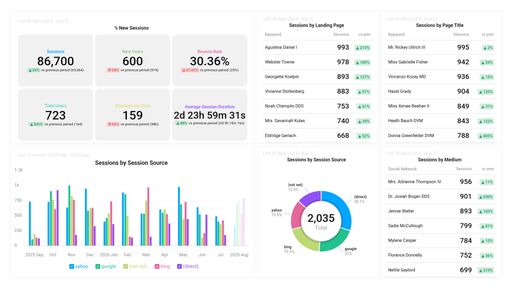
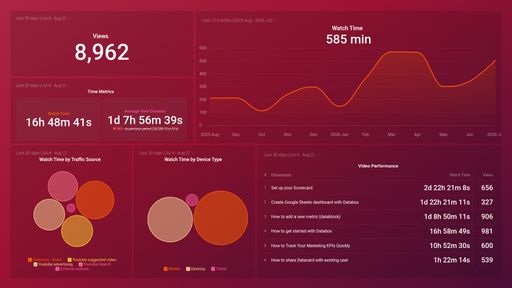
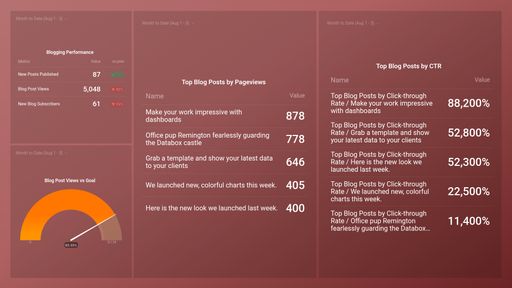
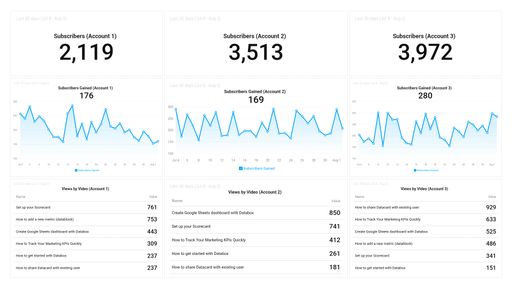
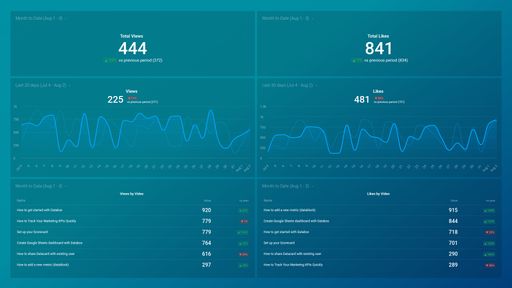
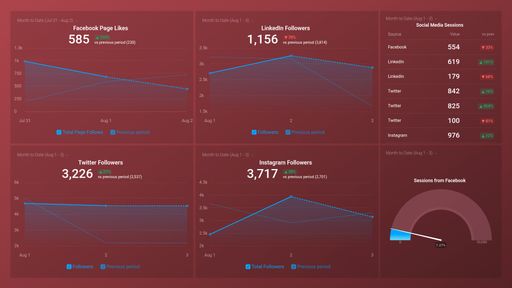
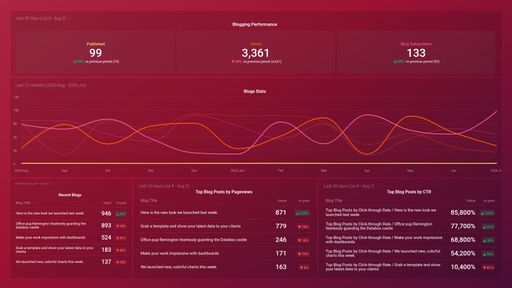
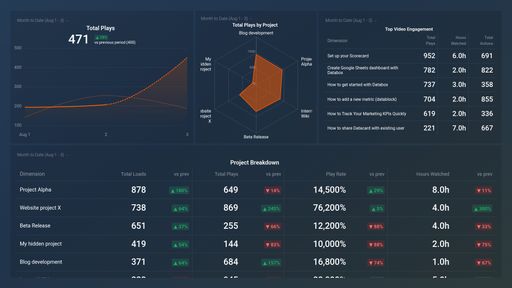
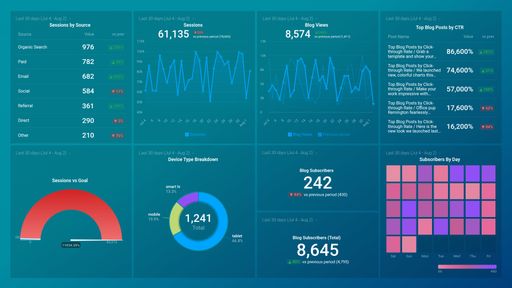
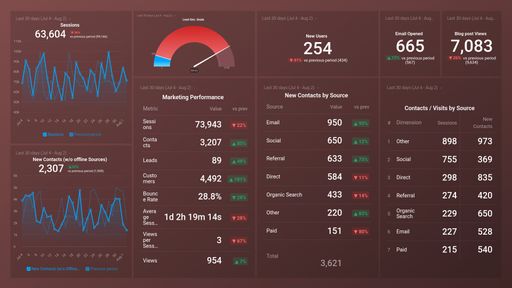
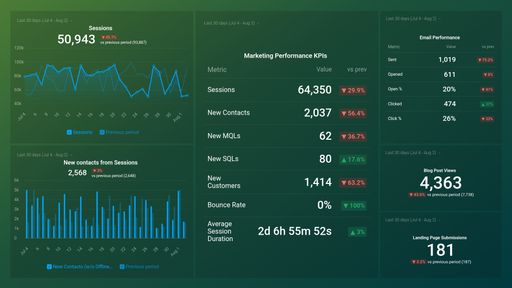
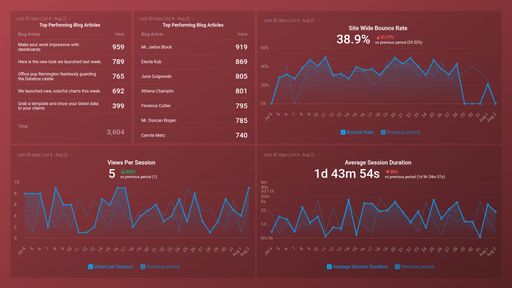
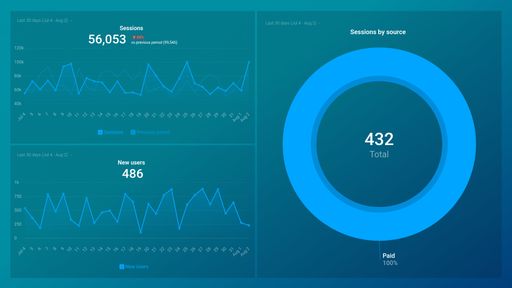
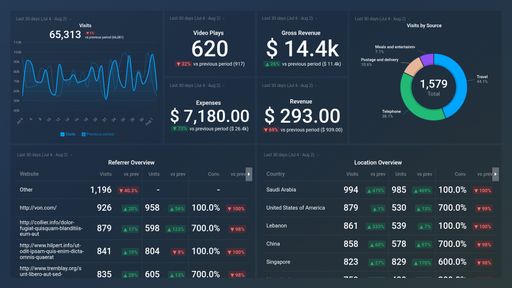
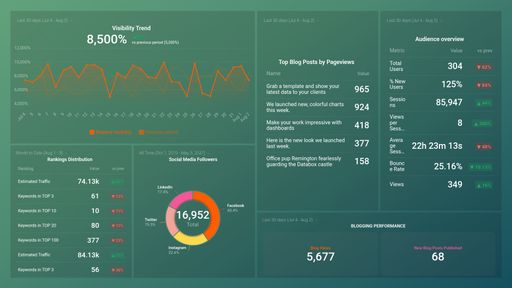
A comprehensive content marketing dashboard should include any metrics you need to monitor in order to optimize your content marketing efforts, such as number of blog sessions, sessions by channel, top-performing pages, average time on page, CTR and more.

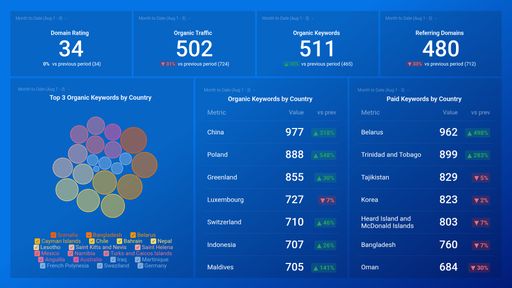
A carefully crafted content marketing dashboard should help inform your content marketing strategy by answering which keywords generate the most clicks, which keywords drive the most traffic, which blog posts drive the majority of your traffic and more.

Tips for Creating a Content Marketing Dashboard

A content marketing dashboard can be an effective way to organize all of your metrics in one place. Once set up, you and any stakeholders can see where you stand in a matter of minutes. Here are some things you should have in mind when creating a content marketing dashboard.

Define Your Content Marketing Goals

When building a comprehensive content marketing dashboard, the first thing you need to do is to determine the key metrics that you should be tracking based on the content marketing goals you’ve set. For example, is your content designed to generate leads, reduce customer support inquires, drive attendance to events, or increase site traffic?

In order to measure return on investment (ROI) the right way, you need to know how well your content is performing based on what it’s designed to do. This way, you won’t get lost in a sea of useless metrics.

Consider Which Questions You Want Your Dashboard to Answer

An effective content marketing dashboard should always answer key questions that can help you optimize your digital marketing campaigns. Therefore, when building a dashboard, thinks of the questions that need to be answered before you decide which metrics to track. These questions could be:

  • What content is bringing in the most traffic?
  • Which keywords should I focus on?
  • How can we improve our CTR?
  • How can we improve our search ranking?
  • Which pieces improve conversions

Often, a good question needs several metrics to answer it. Customize your dashboard accordingly and add metrics that will help you answer questions integral to your marketing campaign.
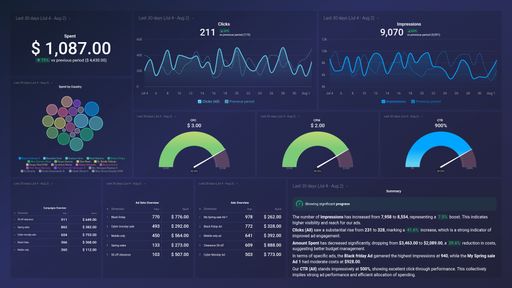
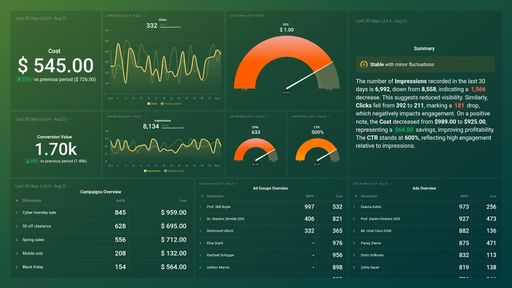
Choose Your Metrics

The next step is to identify the metrics your team needs to see in order to evaluate the success of their content. Most marketers recommend prioritizing the following content marketing metrics:

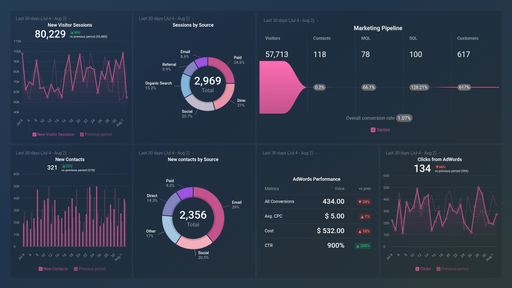
  • Acquisition source. How users find your content - through organic search, internal website navigation, or referrals from social media posts etc.
  • Exit rate. The number of times a piece of content was the last thing a visitor viewed before they navigated off the site.
  • Average time on page. Average amount of time (in seconds) that users spend on a single page.

Keep It Simple

In data visualization less is more. Your content marketing dashboard should show your North Star as well as all its supporting KPIs. Marketers often tend to look at too many data points when it comes to reporting on content marketing strategy. It’s important not to confuse your reporting dashboard with the place where you review and optimize your activities.

Save Time by Using with a Template

If you are not sure where to start or what metrics to include, try using a prebuilt template that already includes the most commonly visualized metrics and data sources.

Create Custom Segments

Focus not just on what content brings traffic and inspires action, but which traffic is relevant for the business. This way, the marketing team will identify the content pieces that generate business rather than marketing results.

To do this, you can, for example, visualize custom segments of your website on your dashboard – for example blog posts, case studies, landing pages etc. Once you bifurcate the content under all these heads properly you can track whether the blog is performing better, case studies, or any other section.

Create Filters

Before pulling data into your dashboard, make sure you create filters in Google Universal Analytics and other tools you plan to use to get rid of the white noise that can send you down the wrong path.

For example, if you are using GA, by filtering out bounces and prospects who land on your page and don’t hang around, you will get more accurate numbers for your conversion data under the Acquisition Source/Media Report.

Set Up UTM Tags

Most marketing dashboards only check the superficial metrics, but bots know to emulate those items. By getting creative and tagging everything, you’ll have more visibility into your audience and their behaviors.

So make sure you tag everything – not just links or video plays, but tag scrolling down a page, tag thresholds of mouse movement, tag the time lingering over different pieces of content.

Compare Engagement Metrics

Compare useful engagement metrics over time to gauge performance and improvement. Particularly useful metrics are Bounce Rate, which helps you determine if you are delivering on the click-expectations you’re setting for your audience, and Average Time on Page which helps you see if visitors are actually consuming the content.

Add Key Traffic Metrics

To measure the effectiveness of content marketing efforts, you have to look at the channels people are using to access your content. Break down all of your goals and events by acquisition channel using the default channel dimensions or even better, customize your default channel groupings.

Organize Information According to Your Customers’ Buying Journey and Overall Sales Strategy

Using a combination of dashboards specific to certain content marketing activities and segments specific to certain personas you will better understand how content is performing at a high level, and also allow you to get more granular in terms of the audiences you’re are hoping to reach.

For example, organize content that is meant to be educational during the awareness stage of your buyer’s journey and create a dashboard for that.

Or organize a general content dashboard in the form of a funnel starting with top-of-the-funnel or reach metrics (visits, views, sources, etc.) followed with middle-of-the-funnel or engagement metrics (time on page, bounce rate, etc.) and end it with deep-in-the-funnel or conversion/intent metrics (form fills, phone calls, subscriptions, etc.)

Either of the above options will allow you to adequately evaluate, revise, and improve your content strategy accordingly.

How to Create a Content Marketing Dashboard

Using Databox’s Dashboard Designer, building a dashboard is as simple as connecting a data source, choosing the metrics you need from our Metrics Library, and watching your visualizations populate in seconds. No coding and design skills are required.

Create a new dashboard using our Designer tool
Name your dashboard
Name your dashboard
Select a data source
Drag-and-drop pre-built metrics from that source to your dashboard or drag a blank visualization first and select the metric you’d like to associate with it.
Drag-and-drop pre-built metrics from that source to your dashboard
Customize each metric block by date range, comparisons, goals, and more.
Customize each metric block