Uses one-click integrations:
-
 YouTube
If you don't use YouTube, you can pull data from any of our 130+ one-click, native integrations or from spreadsheets, databases and other APIs.
Try this dashboard for freeWhat you’ll learn from this YouTube Multiple Channels Dashboard Template:
Connect your YouTube account and learn:
-
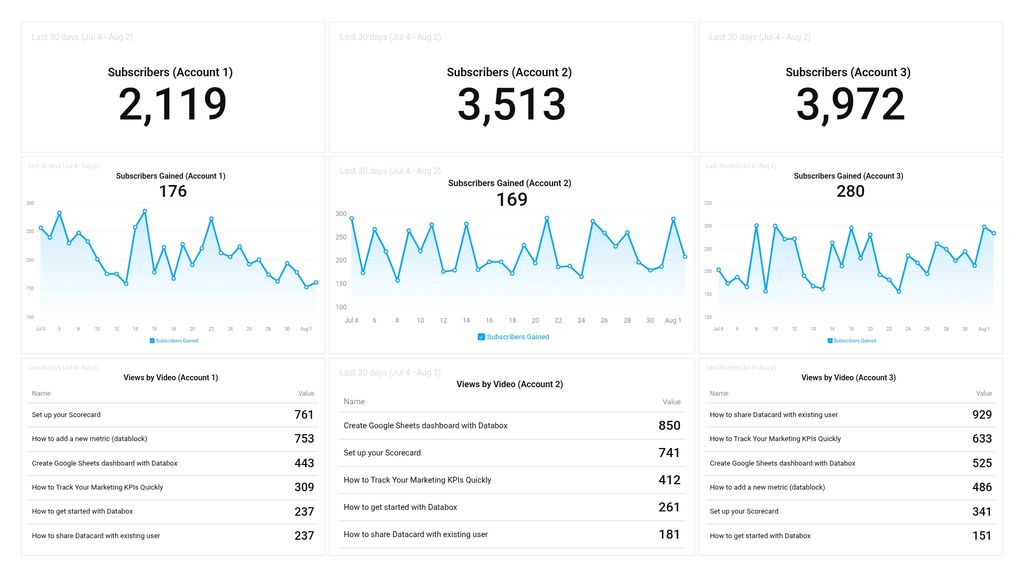
- Which of my YouTube channels has the most views? See which of your YouTube Channels is getting the most views. By tracking this data, you’ll learn which topics your audience is most interested in based on your best performing videos from the multiple channels you manage.
- Which of my YouTube channels has the most subscribers? See how many people or accounts have subscribed to receive updates on your latest videos across all channels you manage at any given time. Your most-subscribed channel is a good indication your videos are of excellent quality and are relevant to your audience.
- How do I track the growth of my channels’ subscribers simultaneously? Visually monitor the growth of your subscribers on a daily basis for each YouTube channel you manage. The more subscribers your channels amass, the more visibility your videos will get.
Pull additional data using our integration with YouTube
What other YouTube metrics can you track and visualize with our integration with YouTube?
- Identify your traffic sources
- Learn audience demographics
- Viewer retention
- Subscriber count
- Video engagement
- YouTube referrals, and more.
There are numerous metrics and metric combinations you can track using YouTube. And in Databox, you can quickly visualize dozens of YouTube metrics in a variety of different ways.
Read more about Databox’s YouTube integration.
Explore more YouTube dashboards.
YouTube metrics included in this template
-
Views by Video
The Views by Video metric shows the number of times a specific video has been viewed on YouTube. This metric helps measure the popularity and engagement of a video with viewers.