Uses one-click integrations:
-
 LinkedIn Company Pages
If you don't use LinkedIn Company Pages, you can pull data from any of our 130+ one-click, native integrations or from spreadsheets, databases and other APIs.
Try this dashboard for freeWhat you’ll learn from this LinkedIn Company Page Engagement dashboard template:
Connect your LinkedIn company page account and you’ll learn:
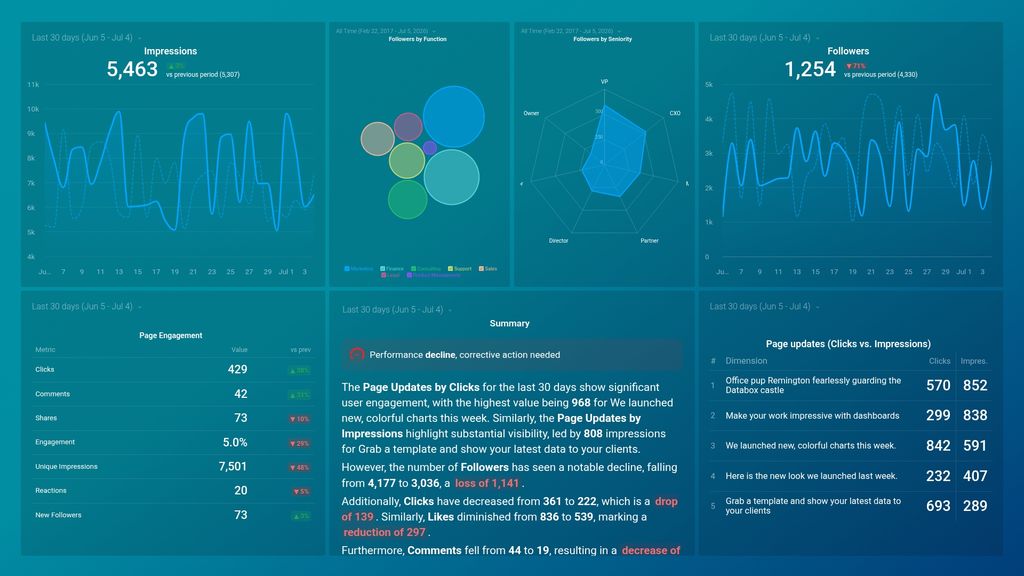
- Which page updates receive the most engagement? Track the specific page updates that generate the most impressions and clicks. Use this information to better understand the content that resonates best with your audience and double down on what’s working.
- How many website visitors do we generate from LinkedIn? Track the overall number of clicks your company page receives from LinkedIn. Monitor clicks over time and see if your following is growing or if you need to make adjustments to your strategy in order to scale engagement along with your following.
- How are people engaging with our content on LinkedIn? Track the number of impressions, clicks, comments, shares, and followers your LinkedIn company pages receive in any given time period. Use these insights to report on the ROI of your LinkedIn efforts and make adjustments to your strategy when needed.
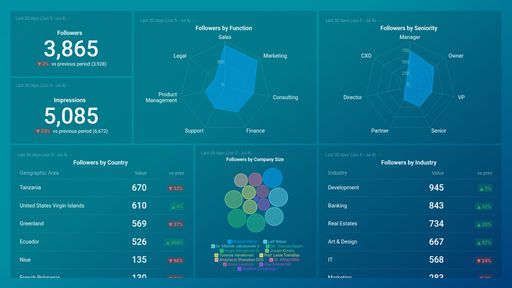
- What are the demographics of our LinkedIn followers? Learn more about your following by tracking the seniority (VP, Director, Manager, etc.) and function (Sales, Marketing, HR, etc.) of your followers and the overall percentage each one represents of your overall following.
- How many followers do we have? Track the total number of followers your Linkedin page has generated. Monitor engagement over time and see which days, weeks, months, etc., have resulted in the highest number of new followers. Correlate these results with your marketing efforts and double down on what’s working.
Pull additional data using our robust integration with Linkedin Company Pages
What other campaign metrics can you track and visualize with our integration with Linkedin company pages? Almost anything:
- LinkedIn ad performance
- Impressions, engagement, clicks, comments, and shares
- Follower demographics
- Pageviews and Unique views
- Progress towards your campaign goals, and more
In Databox there are dozens of LinkedIn metrics already built and ready for you to visualize in a variety of different ways. With the use of Query Builder and Data Calculations, the range of different metrics and metric combinations you can track from Linkedin company pages.
Read more about LinkedIn Company Pages integration.
Explore more LinkedIn dashboards.
LinkedIn Company Pages metrics included in this template
- Engagement %
-
Clicks
The Clicks metric on LinkedIn Company Pages measures the total number of times users have clicked on content or elements on your page, such as links, posts, images, and buttons.
- Clicks by Page Update
-
Comments
The Comments metric on LinkedIn Company Pages measures the number of responses and reactions from users on posts and updates, reflecting engagement and interest in your company content.
-
Followers by Function
The Followers by Function metric categorizes a LinkedIn page's audience based on their job functions, providing insights on the types of professionals following the page.
-
Followers by Seniority
Followers by Seniority metric on LinkedIn Company Pages shows the distribution of followers based on their seniority level, such as entry-level, mid-level, or senior management, providing insights into your audience demographics.
-
Impressions
Impressions refer to the number of times your LinkedIn Company Page content is displayed on someone's screen, whether or not they engage with it. It indicates the potential reach of your posts.
- Impressions by Page Update
-
Shares
Shares metric on LinkedIn Company Pages measures how many times your page's updates have been shared by users, increasing visibility and reach among their connections.