


Table of contents
If you’re involved in making video content, most likely, your YouTube channel is incredibly important to your business. In fact, since it’s the biggest video hosting platform out there, as a video marketer, you simply can’t afford to ignore it.
But to make the best use of video marketing on YouTube, you need to be able to track and analyze how your channel is performing. This should be simple, right? Just check the likes and subscribers and you’re good to go!
Well, that’s not quite true. Too many people are still focused on the “classical” metrics like likes, ratio, and subscriber count. While important, they’re hardly the only thing you should pay attention to.
So, if you want to create a comprehensive YouTube Analytics report, you need to dive deeper into the data and identify the metrics that really matter.
In this article, we’ll cover everything you should know about creating a comprehensive YouTube report:
- How to Use YouTube Analytics
- Most Important YouTube KPIs and Metrics
- How to Create a YouTube Analytics Report
- Standard YouTube Analytics Reports

How to Use YouTube Analytics
YouTube Analytics gives you more than simply raw numbers, it helps you understand your audience better. You’ll be able to identify which of your videos are drawing in the largest audience, which are being watched all the way through, where the majority of your audience is coming from, and much more.
YouTube’s native platform is a true treasure trove of valuable insights, but it can overwhelm someone who isn’t used to it. To access YouTube Analytics, first, you need to click on your profile icon in the upper right corner and select YouTube studio. A list of icons should open up on the left-hand side of the screen — select Analytics.
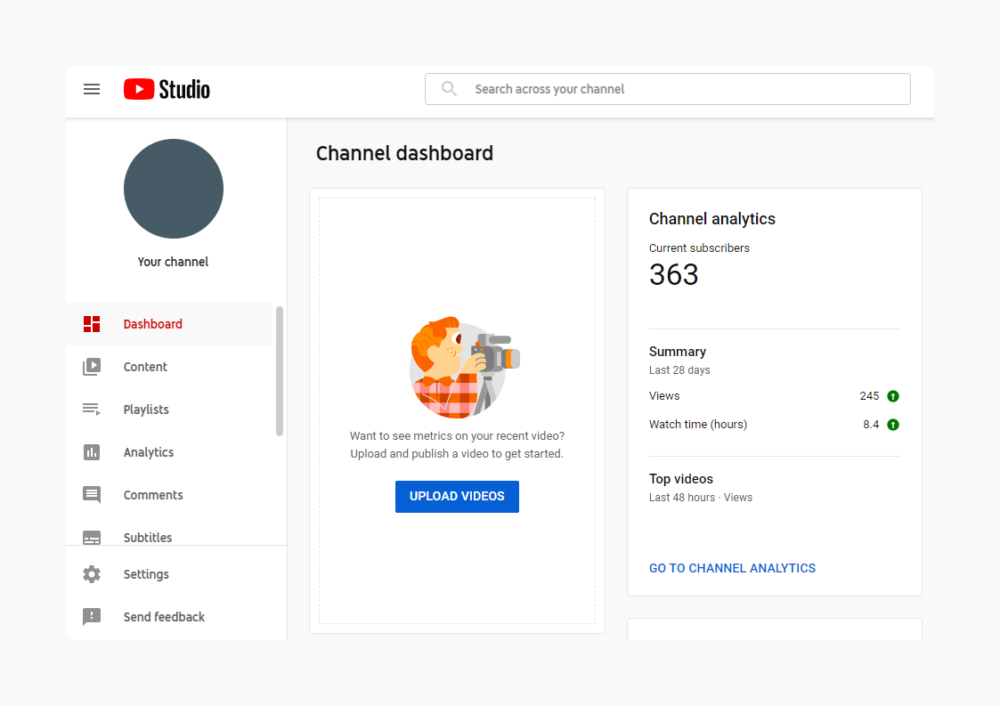
There should be four or five Channel analytics tabs on your dashboard: overview, reach, engagement, audience, and revenue. However, the revenue tab is available if you’re monetizing the channel through YouTube. By clicking on these tabs, you’ll find detailed metrics about your account’s performance, and if you need more information, click on the ‘Advanced Mode’ in the top right corner. That way, you’ll get individual metrics for each video.
You can also track YouTube channel performance directly through your Google Analytics dashboard. To connect YouTube with GA, click the Admin gear icon in the lower-left corner of your GA dashboard and then select Create View. All that’s left to do is to fill out the form and create a filter that shows only YouTube traffic. Select Filters, name your new filter, and select Custom. Finally, click Include and choose Hostname from the menu, and type “youtube” in the Filter Pattern box.
Are analytics and reports that you are obtaining from YouTube KPIs or Google Analytics the same thing? Not exactly. Analytics is the process of collecting and analyzing data to gain insights directly in the YouTube platform, while reports in Google Analytics are pre-designed presentations of data that provide a summary of key metrics or KPIs from YouTube and e.g. landing page or website as well – if set so.
Most Important YouTube KPIs and Metrics
While YouTube provides a lot of data for us to analyze, building a comprehensive and, more importantly, useful report can be tricky unless we know what we’re looking for and what information is useful in which context. Some metrics are important on the channel level, others only on the video level.
To further complicate things, metrics that we’re used to from other types of content aren’t necessarily relevant in the same way for video. And they may be even less relevant for YouTube since it uses its own ranking and curating algorithm.
Another complicating factor is the aim of your channel. Is it brand awareness or advertising? Do you aim to educate people about your products or the problems they might solve? To help with that, we have a full article covering essential YouTube KPIs that also provides in-depth explanations and industry insights.
Here are some of the big ones:
Engagement
This is a broad metric that covers likes, shares, comments, and a lot more. Video engagement is a qualitative metric that can help you gauge the video’s emotional impact based on user interaction. In addition, it can assist in generating future content ideas.
Watch time
This is definitely one of the most important metrics to keep an eye on. While views are important, they’re not enough. If the people aren’t watching the video all the way through, that’s a sign they’re not engaging with the content the way you want them to. In addition, higher watch time leads to YouTube ranking your video more highly in the search results and recommendations.
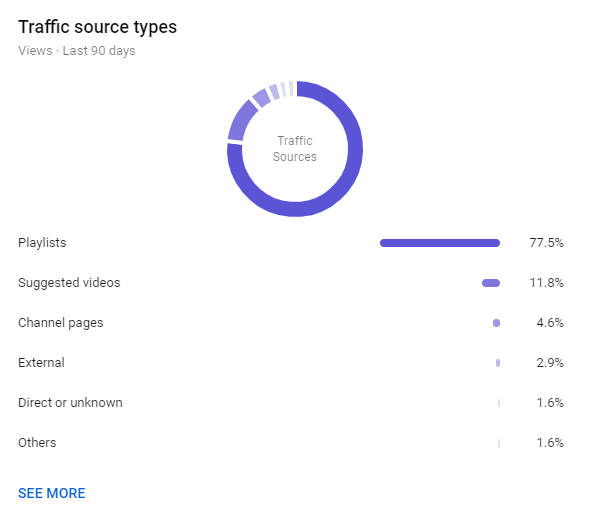
Traffic source
This metric tells you how to add the right tags and keywords to your content. By analyzing what the users were watching or looking for before reaching your video, you can fine-tune your descriptions and tags to better match user intent, which will give you a better chance of appearing among “suggested videos.”
Related: 15 Things You Will Learn From Analyzing Your Traffic Sources in Google Analytics
Lead generation
This metric is particularly useful for brands that use YouTube for direct sales and marketing. In addition to tracking lead generation across the channel or campaign, you can use information about lead generation to keep track of other important metrics and KPIs.
You can use it to figure out which videos drive the best leads or most leads, where traffic to high-converting videos comes from, and where you can improve. For example, you can change the videos, change your posting frequency, update your advertising campaign, or any apply any number of practices depending on the results you get.
View velocity
This metric tracks how quickly your video accrues views. Established channels have the highest velocity shortly after the video is published, while the newer ones tend to have it increase later, as people discover the channel and start engaging with the content.
Channels with a constant stream of high velocity videos are more likely to have their video featured on YouTube’s homepage.
Related: Dozens of Marketers Share How to Get More Views on YouTube
Actions after viewing
At first glance, this may seem to be a paradox, but actions a user takes after viewing a video can be just as important as what leads them to the video. Did the viewer click on the CTA button or close the window? Did they continue watching the playlist, select a different video, or click a link in your description?
This information will tell you how to better engage with your users and keep them on your channel for longer.
Subscribers gained and lost by video
This tends to be a more important metric than subscriber gains and losses on the channel as a whole. It allows you to better understand what videos are bringing new subscribers and which ones are potentially losing them. Once you know that, you can try to identify why that’s happening and make the necessary adjustments.
Related: 25 Marketers Share How to Grow Your YouTube Channel, Subscribers, and Views
PRO TIP: Analyze Your YouTube Channel Performance Like a Pro
To find out what types of video content perform best with your audience, you may track video engagement metrics such as watch time, number of views, likes and dislikes of each video individually using a variety of tools, including YouTube itself.
Now you can quickly monitor your video content performance in a single dashboard that monitors fundamental metrics, such as:
- Average watch time. How much time do viewers spend watching your video content?
- Watch time by video. Which videos drive most of your audience watch time each month?
- Subscribers gained vs lost. How quickly are you gaining or losing subscribers?
- Number of likes, comments and shares. How engaged is your audience?
Now you can benefit from the experience of our video marketing experts, who have put together a plug-and-play Databox template showing the most important metrics for measuring your YouTube channel performance. It’s simple to implement and start using as a standalone dashboard or in marketing reports!

You can easily set it up in just a few clicks – no coding required.
To set up the dashboard, follow these 3 simple steps:
Step 1: Get the template
Step 2: Connect your YouTube account with Databox.
Step 3: Watch your dashboard populate in seconds.
How to Create a YouTube Analytics Report
In order to create a YouTube Analytics Report, you’ll have to follow the steps we outlined in the “How to Use YouTube Analytics” section and find the report you want to export.
When you enter the advanced mode or click on the SEE MORE option, you’ll be able to get specific metrics, compare performance, and export data.
Before exporting the data, you can change the chart type, dimensions, date range, filter data, and even switch between analytics for the channel as a whole, specific videos, video groups, or playlists. It’s a robust tool that does offer a lot of functionality, and you can play with the data sets and their presentation in a lot of ways.
After fiddling with the metrics and making sure the report contains everything you want it to, you’re ready to export the report. In order to do that, you just need to click on the “Export current view” button in the upper right corner.
Related: 7 Of The Most Common Challenges Of Social Media Reporting and Tips to Overcome Them
Standard YouTube Analytics Reports
Trying to cram every bit of information into a small space just leads to clutter and makes the data difficult to parse. Here are standard YouTube Analytics reports that focus on specific metrics or sets of metrics that will tell you how your channel is doing.
The following list is not comprehensive, and some report types can be split into sub-reports if you want to focus on specific metrics.
1. General Reports
These are the basic, go-to reports that cover the most important things.
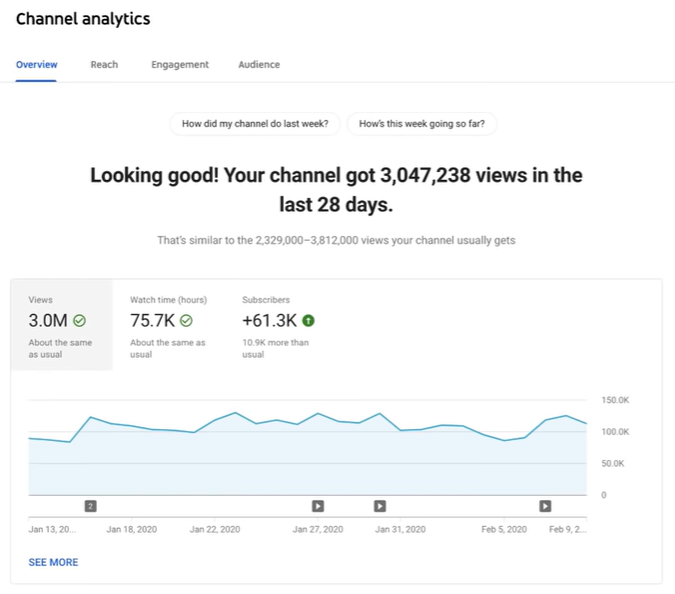
The Overview Report gives you a high-level summary of how your channel and videos are doing. It’s easy to understand, and it’s excellent for those situations when you don’t have the time to do a deep dive into the numbers.
The Realtime Report does exactly what it says on the tin. It gives you an estimate of view count data for your recent videos — including people watching them right now. This report is great if you’re putting out regular videos and want to track metrics frequently.
2. Watch Time Report
The Watch Time Report aggregates data from both the YouTube homepage and the mobile app to create a breakdown of viewer retention. It covers average view percentage, estimated minutes watched, average view duration, watch time, views, and so on.
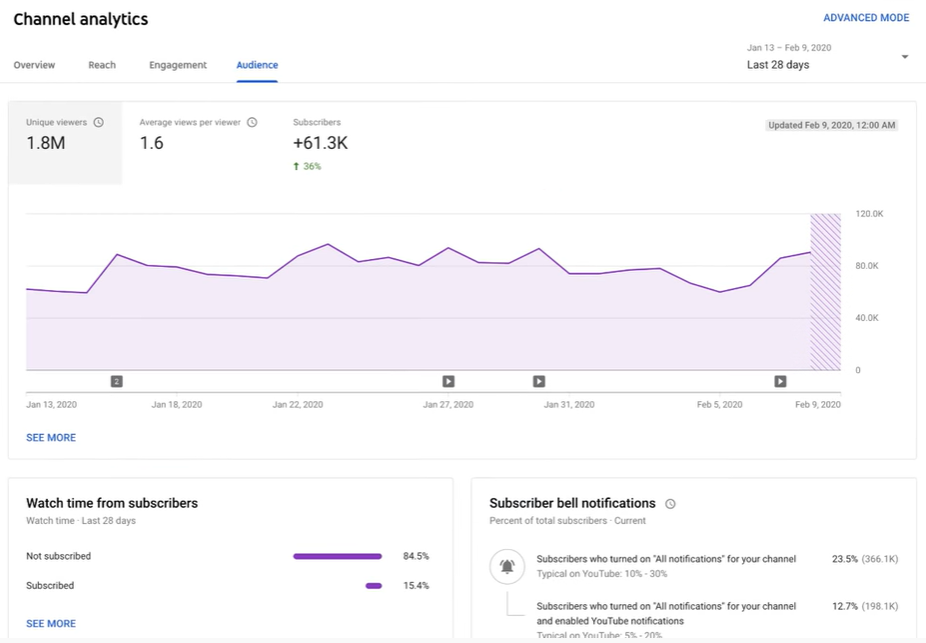
3. Audience Retention Report
By looking at the metrics in this report, you’ll be able to understand whether or not your viewers are sticking to your videos. The audience retention curve tells you which parts of the video are popular or not and which videos, in particular, have a low/high retention rate.
4. Playback Locations Report
This report highlights where users are viewing your videos (YouTube directly or embedded videos) and lets you know where they’re finding it. If the video was viewed on YouTube, you’d find out if it was watched from the channel’s page or the video’s specific page.
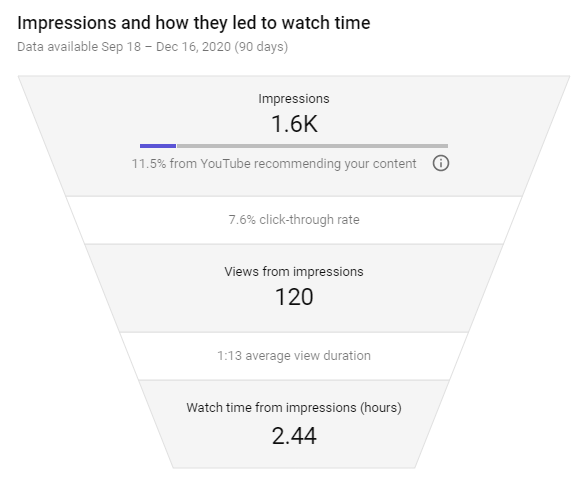
5. Traffic Sources Report
If you want to find out YouTube features, apps, or sites viewers used to find your videos, this is the report for you. It lets you know if your optimization and promotion strategies are working or if they need some fine-tuning.
6. Devices Report
This report will give you information on the different devices — PCs, tablets, phones, TVs, consoles — and operating systems — Windows, iOS, Linux — viewers are using to access your content.
The benefits are twofold. First, you can adjust your advertising and promotion strategies to adjust to your demographic. Second, you can adjust the type of content you’re making; mobile users tend to look for short videos, for example.
7. Engagement Reports
Engagement is an important KPI, and it encompasses a lot of other metrics, including likes, dislikes, subscriptions, sharing, and comments.
Depending on the type of content you’re publishing, they have different “weights.” Videos aimed to entertain need to have a high number of likes and shares, while educational videos might be looking for subscriptions.
8. Earnings Reports
Finally, there’s the Earnings report. It’s relevant for anyone who wants to post ad-friendly content and keep track of their earnings.
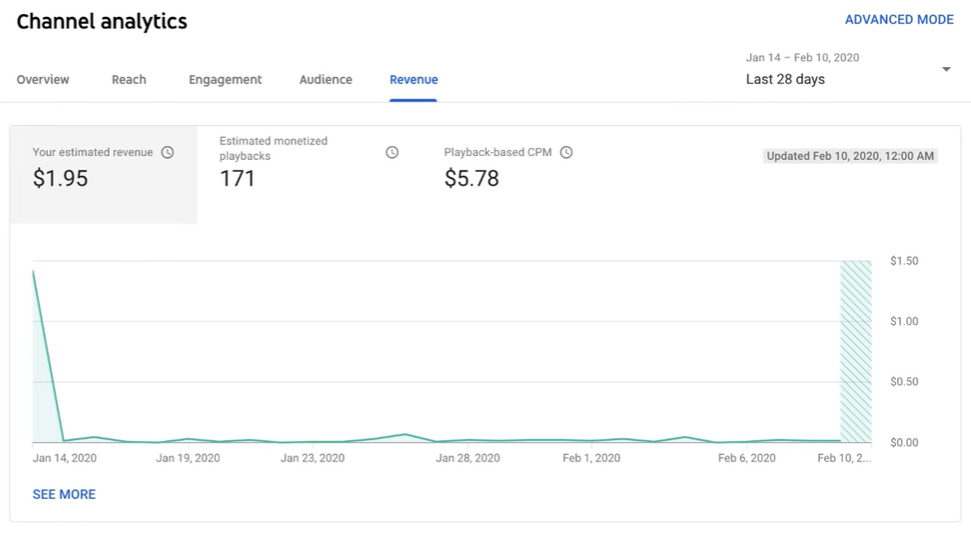
You can focus on ad rates if you want to determine how different ad types perform or on estimated earnings if you want to see detailed earnings breakdown related to transactions, YouTube Red, or ads.
Discover which Videos Create the Most Buzz About Your Brand with Databox
Video marketing is more important than ever, and YouTube is an inescapable part of that equation. Tracking the right metrics and KPIs is important, but what’s equally important is being able to make sense of the data and even present it in the right way.
While raw YouTube Analytics are useful, they can be dense and difficult to parse, especially if you’re using advanced options, not to mention if you need to present it as a report.
If you need a simple and quick way to tell how your YouTube channel is doing, Databox offers a YouTube integration that will allow you to track your most important KPIs like Likes, Shares, Subscribers, Views, etc. no matter where you are.


