Table of contents
Here’s the truth: without proper data cleaning, your dashboards, forecasts, and strategy are built on shaky ground. In fact, bad data is already costing U.S. businesses more than $3.1 trillion a year, according to one IBM study. That’s not just a number – it’s lost deals, missed targets, and wasted hours chasing down the wrong metrics.
“One of the biggest bottlenecks in our workflow is bridging the gap between raw data and actionable insights fast enough to influence real-time decisions. With so many data sources and platforms, aligning everything into a clear, unified view takes time.”
– Jonathan Aufray of Growth Hackers
Why high‑quality data matters more than you think
Whether you’re an executive shaping strategy, an analyst wrangling spreadsheets, or a team member making daily calls, clean, high-quality data is the backbone of confident decision-making. This guide will walk you through practical ways to reduce errors, streamline your workflows, and turn raw, messy data into insights you can actually use. From automating deduplication to scaling reliable reporting processes – this is your playbook for better business outcomes.
What is data cleaning? (The real definition)
Data cleaning means finding and fixing errors, inconsistencies, and junk in your datasets so you can actually trust them for analysis and decision-making. It’s not just fixing typos – it’s about getting your data ready for complex queries, dashboards, and automated reports.
Here’s how data cleaning is different from related tasks:
Data cleaning
What it is:
Data cleaning is the process of fixing errors in your existing data. That includes:
- Removing duplicates
- Filling in missing values
- Standardizing formats (like dates, text capitalization, or number types)
- Resolving inconsistencies (e.g., “NY” vs. “New York”)
- Converting incompatible field types (convert text strings that hold numbers into numeric fields so calculations don’t break)
Why it matters:
Cleaning helps ensure accuracy and consistency. Without this step, your analysis can be skewed by bad inputs – leading to misleading reports or dashboards.
“I want to automate and simplify the process of cleaning and validating lead data when managing datasets with thousands of records, so I can minimize manual effort and reduce mistakes…”
– CRM Data Analyst, mid-sized business (Marissa S., Databox client)
Data cleansing
At first glance, “data cleaning” and “data cleansing” might sound like the same thing. But while both improve data quality, they’re not identical—and understanding the difference can help you choose the right approach for your needs.
What it is:
Data cleaning is all about quick fixes. It’s the process of automatically correcting obvious issues in your data—like removing duplicates, fixing typos, standardizing formats, and filling in missing values. Think of it as tidying up a messy room. It makes your data usable and reliable for day-to-day tasks.
Most teams automate this process so it runs continuously as new data flows in
Data cleansing takes it a step further. It’s a deeper, more strategic process that involves:
- Validating data against external sources
- Collaborating with domain experts to resolve inconsistencies
- Enriching and standardizing records
- Ensuring compliance with governance rules
- Exploring and consolidating variations in specific fields
Insycle puts it well: “A huge piece of the data management puzzle is understanding what you have in your database and cleansing it so it is uncluttered, formatted correctly, and standardized. But before you can begin fixing issues, you first have to identify what those issues are.”
Why both matter:
Data cleaning keeps your data functional—it’s like routine maintenance. Data cleansing is more like a full audit and tune-up. You’ll need both to make sure your data stays useful in the short term and trustworthy in the long term.
When you’re running a quick campaign report, basic cleaning might be enough. But when you’re building a strategy based on historical trends or predictive insights, you’ll want the confidence that comes from thorough cleansing.
Data preparation
What it is:
Data preparation goes a step further than cleaning. It includes cleaning plus:
- Merging data from multiple sources (e.g., CRM + payment data)
- Reshaping or restructuring datasets (e.g., pivoting rows to columns)
- Creating new fields (like calculated metrics or categories)
Filtering or transforming data to align with business needs
Why it matters:
Preparation turns raw, cleaned data into a structure that’s usable for reporting, dashboards, or analytics tools. It’s how you build a curated “source of truth” across systems.
“We need a process for accurately matching and merging datasets using common identifiers – this underpins our ability to generate actionable business reports…”
– Business Intelligence Lead, E-commerce Retailer
Learn more about a Data Preparation framework here.
Data wrangling
What it is:
Data wrangling is the exploratory phase. It’s about:
- Investigating your data
- Identifying potential quality issues
- Deciding what needs to be cleaned, transformed, or restructured
It’s a mix of profiling, testing, and tweaking before formal cleaning or preparation happens.
Why it matters:
Think of wrangling as the detective work that informs your next steps. If you skip this step, you might miss deeper issues or apply the wrong fix.
“I’d rather go through and create the cleaning process myself and from there automate it once I understand the data…”
– Data Engineer, Reddit discussion

Each step builds on the last. Together, they help you create clean, reliable, analysis-ready datasets that power better decisions – especially when working across messy tools like spreadsheets, CRMs, or marketing platforms.
The stakes are high. According to Harvard Business Review, only 3% of companies have data that meets basic quality standards. When bad inputs ripple through dashboards, high‑quality data becomes more than a technical nicety – it’s the difference between credible data analysis and expensive guesswork. Treat every dataset as an asset that must be protected, validated, and refined before you risk decisions – or dollars – on it.
The real cost of messy data
According to Gartner’s 2021 research, poor data quality costs the average organization about $15 million per year. But here’s the kicker – 60% of companies don’t even measure how much bad data costs them because they don’t track it.
Your analytics team is probably spending 45% of their time just preparing and cleaning data. That means your highest-paid people are doing data janitor work instead of finding insights that actually help the business.
“Excel lacks intelligent features to identify formatting issues, making this work not only time-consuming but also mentally taxing, especially when handling thousands of leads.”
– Marketing Operations Manager, SaaS Company (Databox internal calls archives)

If you’re at an agency, dirty data creates even more problems:
- Clients lose trust when reports have obvious mistakes
- You waste billable hours on repetitive cleaning tasks
- Results aren’t consistent across similar clients
- You can’t scale your services because everything requires manual work
Teams spend way too much time double-checking numbers, trying to figure out why reports don’t match, and explaining data problems in meetings instead of actually using insights to improve the business.

According to Anaconda’s 2020 State of Data Science Survey, companies report that their analytics teams spend the highest amount of time 45% doing data cleaning, 35% analysis and 20% for other tasks.
Data cleaning challenges by role
Different roles need different approaches to data cleaning. Here’s what each type of team member faces:
Executive leaders
You need trustworthy data for big decisions and measuring performance. Your biggest worry is data blind spots – when bad data makes you overconfident or hides real problems. When your KPI dashboards show conflicting numbers, it’s hard to make confident decisions about where to spend money and what strategies to pursue.
Data analysts and BI specialists
You deal with the messiest part – working directly with raw data from multiple sources. You have to balance automation with manual checking while dealing with tool limitations and systems that don’t play nice together.
“We need a process for accurately matching and merging datasets using common identifiers – this underpins our ability to generate actionable business reports from disparate data sources.”
– Business Intelligence Lead, E-commerce Retailer (Databox internal calls archives)
The biggest challenge? Merging datasets that have different structures, formats, and quality standards. Like when your CRM customer data doesn’t line up with transaction data from your e-commerce platform.
How to do it in Databox: In Databox, you can merge Datasets from different Views within the same Data Source (like HubSpot Contacts and Deals) or across multiple Sources (like HubSpot CRM and Shopify). Similar to SQL joins, this lets you explore more complex questions by connecting data across platforms.
Marketing and sales managers
Ready to prep your first Dataset?
You rely on clean data to measure performance and make strategic decisions. Data quality directly affects your ability to track KPIs, measure campaign effectiveness, and optimize marketing spend and sales processes.
Operations specialists
You work with data your team already cleaned, but you need to understand what happened to it. Clear documentation and consistent formats are crucial for your analytical work.
Essential techniques for cleaning data
Let’s get into the practical stuff. Here are the core techniques that handle most data quality issues:
1. Finding and removing duplicates automatically
Duplicate records typically appear as duplicate rows in a table or dataframe. You need repeatable logic to remove duplicate entries without wiping out legitimate multi‑touch interactions. There are two types to watch for:
Exact duplicates have identical values in all fields. These are easy to spot and remove.
Fuzzy duplicates are trickier – they’re variations in spelling, formatting, or data entry. Think customer names like “John Smith” vs “Jon Smith” or “J. Smith.”
Pro tip: Create composite keys that combine multiple fields to catch duplicates more accurately while keeping your queries running fast on large datasets.
2. Handling missing values intelligently
Don’t just delete everything with missing data – you’ll throw away valuable information. Here are better approaches:
Use averages for numerical data without strong patterns (like replacing missing sales amounts with the average sale amount).
Forward/backward fill works great for time series data where you can use the previous or next value to fill gaps. In SQL, COALESCE() and similar functions let you replace NULL values on‑the‑fly while keeping your query readable.
Apply business logic to determine what makes sense. Missing transaction amounts might be zero, while missing customer segments might get labeled “Unknown” for separate analysis.
3. Making everything consistent
Inconsistent formatting breaks joins and messes up grouping. Standardize these elements:
- Text (consistent capitalization, spacing, special characters)
- Dates (pick one format and stick with it)
- Categories (group similar values under consistent labels)
- Strip nonprinting characters (line breaks, zero‑width spaces) that silently break joins or visualizations
4. Dealing with outliers
Outliers can be real extreme values or data entry mistakes. These are values that sit far outside the normal distribution, like a misplaced decimal turning “99.00” into “9900.” Use both statistical methods (like standard deviations) and business rules (like “ages can’t be negative”) to identify them. Treat each outlier as a lead to investigate, not just something to delete.
Treatment options include capping values at reasonable limits, flagging suspicious data for manual review, or using transformations to reduce the impact of extreme values.
5. Ongoing quality monitoring
Set up automated checks that run when new data comes in:
- Track missing value percentages
- Monitor for business rule violations
- Watch duplicate rates over time
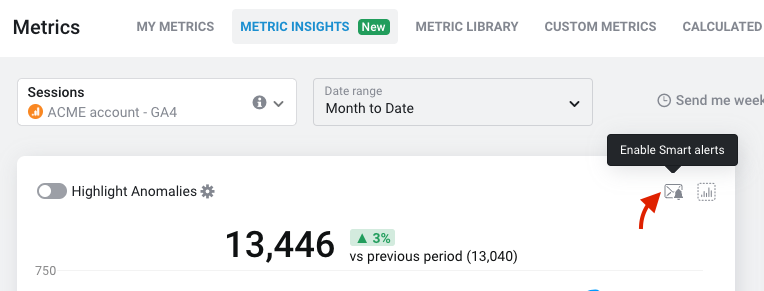
How to do it in Databox: Use Smart Alerts to monitor metric thresholds and unusual changes in performance. While not designed for data quality validation (like detecting duplicates or missing fields), they can surface anomalies that may point to underlying data issues.
Using spell checking & text normalization to get from messy text to clean data
Free‑text columns such as open‑ended survey answers, support‑ticket notes, or product‑review blurbs are equal parts goldmine and grenade. One rogue emoji or a fat‑fingered brand name can blow up a join, skew a count, or flat‑out crash your CSV export. Treat text like any other data asset: profile it, clean it, and keep it on a tight leash.
Why it matters
- “Gooogle” vs. “Google” Two extra o’s and your pie chart suddenly shows a phantom competitor.
- “USA” vs. “usa” Case differences inflate “unique” values and wreck GROUP BYs.
- Smart quotes & emojis Fancy Unicode can choke SQL loaders or turn JSON into gibberish.
Three steps to cleaner text
- Automated spell‑check with custom dictionaries
Pipe your column through Hunspell, TextBlob, or Amazon Comprehend – but load a domain lexicon first so you don’t autocorrect “Shopify” into “Shopping.” - Normalize casing and Unicode
Lowercase everything, strip diacritics, and swap curly quotes for straight ones before tokenizing or running sentiment analysis. - Tokenize & fuzzy‑match near‑duplicates
Use Levenshtein distance or fuzzywuzzy to collapse “Jon Smith” and “John Smith,” or merge hashtag variants like #BlackFridayDeals and #blackfridaydeals.
Tool tips
- Python / Pandas
df['comment'] = (
    df['comment']
      .str.lower()
      .str.normalize('NFKD')  # strip accents
      .str.replace(r'[“”]', '"', regex=True)
)- OpenRefine → Text facet → Cluster & Edit to spot near‑duplicates in seconds.
- SQL Use SOUNDEX() or Postgres trigram extensions for in‑database fuzzy matching.
Watch‑outs
- Over‑eager corrections “H&M” turning into “Ham” is not a glow‑up. Quarantine low‑confidence suggestions for manual review.
- Measure the impact After every sweep, rerun your profiling stats – null counts, distinct values, duplicate rates – to confirm you fixed more than you broke.
Building workflows that actually scale to deliver clean data
Effective data cleaning needs systematic workflows that can handle more data while maintaining quality. Here’s a four-phase approach:
Phase 1: Data profiling
Start by analyzing your datasets to spot patterns and quality issues. Review stats like record counts, missing data percentages, and unique values. Then document your findings to guide your cleaning rules.
Phase 2: Rule creation
Turn your profiling insights into automated cleaning procedures. Start with high-impact, simple rules like standardizing date formats or removing obvious duplicates. Add more complex rules gradually.
Phase 3: Testing and implementation
Run your cleaning rules on sample data first before applying them across the full dataset.
Phase 4: Monitoring
Keep an eye on how your cleaning rules perform as data sources and business needs change. Set up alerts for big changes in data quality or rule performance.
Key things to monitor:
- How long it takes to process each record
- What percentage of records get changed by each rule
- Error rates and rule failures
- Data quality scores before and after cleaning
How to do it in Databox: Leverage Datasets + Calculated Columns to build repeatable logic that prepares data before it reaches your dashboards. These transformations persist as new data flows in – no manual rework needed. For recurring processes, duplicate datasets templates for similar use cases.

Empower your team with clean, reliable data and make informed decisions with confidence.
Start Your Free 14-Day Trial with Databox – No credit card required
Tools that actually work
Different tools are good at different things. Here’s what works best for various scenarios:
Business Intelligence platforms
Many BI tools now include cleaning features:
- Tableau Prep: Visual data preparation with drag-and-drop cleaning
- Power BI with Power Query: Data transformation during import
- Looker: Data transformation during query execution
- Databox: Goes beyond dashboarding with its Advanced Analytics capabilities:
- Dataset Software: Combine multiple data sources into unified, clean datasets.
- Calculated Metrics: Create custom formulas and logic directly in the UI – no code required.
- Filtering and Transformation: Apply rules to cleanse, categorize, or segment data before it reaches your reports.
- Query-based Visualization: Use SQL-like dataset queries to refine your data pipeline in real-time.
- Automated Data Sync: Ensure that your cleaned data is always up to date across sources like HubSpot, Google Analytics, CRMs, and more.
Explore all features → Databox Advanced Analytics
Open-source solutions
For flexibility and customization:
- OpenRefine: Great for interactive cleaning with smart duplicate detection
- Python libraries (Pandas, NumPy): Programmatic cleaning with machine learning
- R packages (dplyr, tidyr): Statistical approaches to missing data
AI-powered tools
The newest category uses machine learning to spot issues:
- Trifacta Wrangler: Uses AI to find inconsistencies and suggest fixes
- TIBCO Clarity: Cloud-based cleaning with tons of data source connections
SQL for data cleaning
SQL is powerful for cleaning because it:
- Works directly on your data without moving it around
- Handles large datasets efficiently
- Creates reproducible, shareable cleaning operations
- Integrates with your existing database setup
SQL is especially good for removing duplicates, filling missing values with business logic, and running validation checks that can be automated and scheduled.
How to do it in Databox: With no-code Dataset Builder, create calculated fields, apply filters, group data, and merge multiple sources. This gives your team SQL-like control over transformation logic – without writing any code.
Agency vs. internal team approaches
Agency use cases
You face unique challenges with multiple client datasets. Each client has different data structures, quality standards, and business rules.
Focus on:
- Creating reusable transformation templates
- Building libraries of cleaning procedures for common situations
- Preventing cross-client data contamination
- Documenting common issues by industry or platform type
Internal teams use cases
You work with more consistent data sources but need to balance different departmental needs.
Focus on:
- Accommodating different analytical needs across departments
- Balancing individual team requirements with organizational standards
- Implementing monitoring to prevent quality regression
- Creating shared dataset governance
“Automating this process would free up our team to focus more on strategy and creativity, not data wrangling.”
– Jonathan Aufray,Growth Hackers
Want to see how clean data transforms your reporting?
Measuring success
Track these metrics to show the value of your data cleaning efforts:
Data quality metrics
- Accuracy rates
- Completeness levels
- Consistency scores
- Timeliness of updates
Time savings
- Hours saved through automation
- Reduction in manual cleaning tasks
- Fewer data-related support requests
- Less time spent on analysis rework
ROI calculation
ROI = (Time Savings + Error Prevention + Better Decisions) ÷ (Tool Costs + Setup + Maintenance)
Organizations typically see a return on investment ranging from 5:1 to 15:1 from data cleansing initiatives, with some companies achieving ROI exceeding 500% within two years.
Common mistakes to avoid
Over-cleaning
Don’t remove too much data in pursuit of perfection. Set business-driven quality standards, not technical perfection. Test cleaning rules on samples first, and create “quarantine” processes for questionable data instead of deleting it immediately.
Also, avoid deleting rows just because one column has a NULL value if the other fields still contain useful data. Instead, consider filling in the missing value (imputation) or adding a flag to mark it.
Too much manual work
Automate high-frequency, rule-based tasks. Save manual review for complex cases and business rule exceptions. Document manual interventions so you can find automation opportunities later.
Poor documentation
Record why you made each cleaning rule, document data sources and their specific issues, create visual workflows, and maintain change logs for rule modifications.
Vendor dependence
Understand the logic behind vendor cleaning tools, maintain internal expertise in core techniques, create backup procedures for critical operations, and regularly evaluate alternatives.
The bottom line
Good data cleaning isn’t about perfection – it’s about making your data reliable enough to support better decisions. Start with a systematic approach, measure your results, and keep refining your process based on what your business actually needs.
The key is to automate what you can, document what you do, and focus on the data quality issues that actually impact your business outcomes.
Stop struggling with inconsistent data.

Data Cleaning FAQs
How does Databox BI Data Prep approach data cleaning?
Databox BI Data Prep handles data cleaning as a built-in part of the workflow and not a separate step. Using Datasets, you can filter rows, create calculated columns, normalize formats, and merge sources with no code required. These transformations are saved and reapplied automatically whenever new data syncs. This ensures your dashboards always run on clean, analysis-ready data without constant manual fixes.
How long should data cleaning take?
Data cleaning typically consumes 45% of analytics teams’ time. For new datasets, expect 20-40% of total project time for initial cleaning. Well-established automated processes should handle routine cleaning in 5-10% of processing time.
What’s the quickest sanity check before I trust a new file?
Load the dataset into a Pandas dataframe (or a SQL staging table) and run three commands: count duplicate rows, profile NULL percentages per column, and generate basic descriptive stats to surface any wild outliers. Five lines of code often catch 80 % of surprises.
When should I automate vs. manually clean data?
Automate repetitive tasks like duplicate removal and format standardization. Use manual intervention for business rule exceptions and complex data relationships.
How to do it in Databox: Use data transformation features for standard cleaning while maintaining manual oversight through Custom Metrics.
Should I use SQL, Python, or Excel for data cleaning?
Choose SQL for: Data already in databases, basic operations at scale, team environments with SQL skills.
Choose Python for: Complex text processing, advanced statistical methods, JSON data restructuring.
Avoid Excel for: Large datasets (over 1 million rows), collaborative workflows, automated processing pipelines.
What are the most common data quality issues?
The most frequent issues include missing values, duplicate records, inconsistent formatting, outliers, and inconsistent data types. Date formatting changes due to system updates and postal codes with inconsistent spacing are also common.
How do I know when data is “clean enough”?
Focus on your analytical goals rather than perfection. Stop when data quality meets minimum requirements for your analysis, additional cleaning shows diminishing returns, and stakeholders accept the quality level for decision-making.
How to do it in Databox: You can also use Smart Alerts to track performance thresholds. For dedicated data quality monitoring (e.g., NULL counts or duplication rates), you may need to modify the dataset and flag these conditions for later use when creating custom metrics.”
How do I prevent data quality issues from recurring?
Implement automated validation pipelines, work with data producers on input validation, establish data entry standards, and create feedback loops with source system owners. As one frustrated practitioner noted: “It should definitely not be our job to ‘fix data’ if people were doing their job correctly with proper change management.
How do I manage data cleaning in team environments?
Establish consistent cleaning standards, use shared tools where possible, document procedures clearly, and implement review processes for significant modifications. Create visibility into cleaning decisions and maintain audit trails.
How to do it in Databox: Standardize your cleaning process using Datasets to unify and structure messy data from multiple sources. Create a single source of truth by applying calculated fields, filters, and merge logic—so your metrics are always consistent and analysis-ready.
Then, use Databoards and Goals to build shared views that everyone can trust. With Metric Builder, you can also define which dimensions (like campaign, region, or rep) are available to viewers—making your dashboards cleaner, more focused, and easier to explore without overwhelming users.