


Table of contents
MongoDB is one of the most popular databases for modern applications. Its flexible, document-oriented model makes it easy for developers to store and query everything from user activity logs and product usage events to application telemetry.
But while MongoDB is great for storing and organizing data, it’s not always easy for business teams to use it to answer questions or track key metrics. The data often lives in a raw format that requires technical skills to interpret. This means non-technical teammates must rely on engineers or analysts for reports—slowing down decisions and keeping valuable insights siloed.
That’s where Databox comes in. Our MongoDB integration lets you connect your database and instantly turn collections into clear, actionable dashboards anyone can use. Track KPIs in real time, set up automated reports and alerts, and give every team the insights they need to make better decisions, faster.
Why Use MongoDB with Databox?
Instead of keeping valuable insights siloed in a database only engineers can query, Databox makes your backend data accessible and actionable for your entire team.
- Access backend data without writing code: Turn raw MongoDB collection’s data into metrics and dashboards that teammates can explore on their own—no queries or BI tools required.
- Build metrics your entire team can trust: Pull exactly the data you need, apply filters, format columns, and merge it with other sources. Then create custom metrics from a single, reliable source of truth.
- Get real-time visibility into performance: Dashboards and reports update automatically as your MongoDB data changes, giving every team an up-to-date view of KPIs and trends.
- Create a unified view of performance: Combine MongoDB metrics with data from your CRM, marketing, finance, and other tools to see your business performance in one place.
MongoDB Integration with Databox Overview
In just a few steps, you can securely connect your MongoDB data to Databox, prepare it for analysis, build trusted metrics, visualize trends, and automate reporting.
Connect MongoDB
Whether you use MongoDB Atlas (cloud) or host it yourself, connecting is straightforward:
- Go to Available Integrations in Databox.
- Select MongoDB and enter:
- Mongo URI (connection string
- Read-only authentication credentials (recommended)
- Database name
- Click Connect and select the collections you want to pull in
For more information, have a look at this article: Connect Databox to MongoDB
Prepare Your Data for Analysis
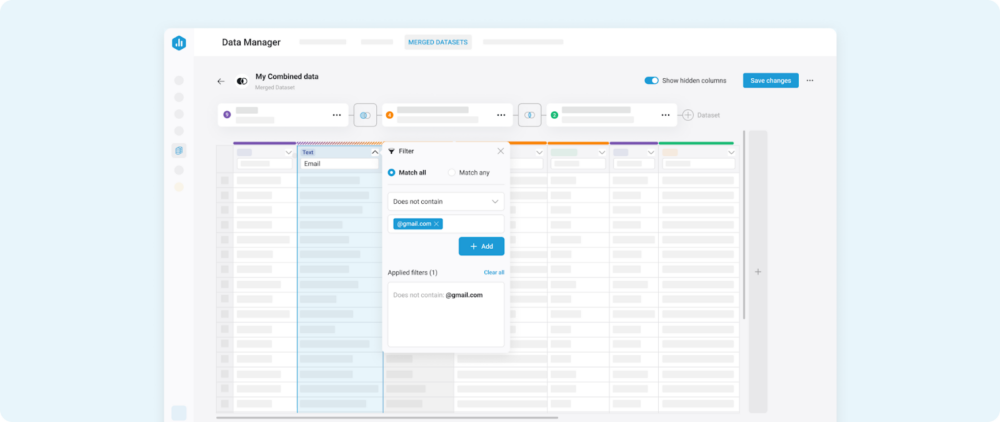
Once connected, you’ll create a dataset—a curated table of raw data optimized for analysis.
Select the collections and fields you want to work with, then:
- Apply filters to remove irrelevant records and focus on the data that matters most
- Format columns as currency, dates, or other types to ensure consistency
- Use formulas and functions to create calculated columns that reflect your unique business logic
- Merge multiple datasets from different sources to provide full context in one place.
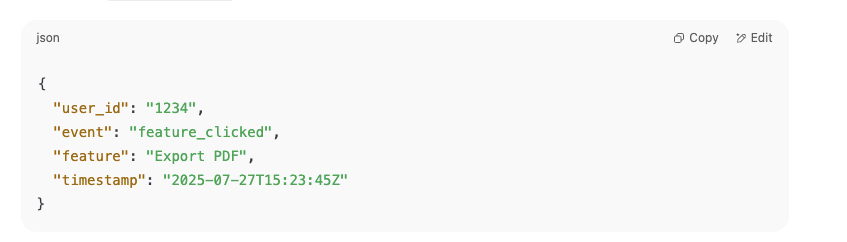
For example, for a MongoDB collection like:
JSON

{

  "user_id": "a1b2c3",

  "event_type": "signup",

  "timestamp": "2025-07-01T09:42:00Z",

  "plan": "Pro"

}
You might want to build a dataset that pulls:
- timestamp as a date field
- event_type as a dimension
- And create a calculated column that counts the number of “signup” events per day
With your dataset in place, your data is clean, structured, and ready for reliable reporting.
Build Metrics Your Team Can Trust
From your prepared dataset, create the KPIs and metrics that matter most to your business, whether that’s daily signups, feature adoption rates, or revenue by plan type.
Every metric comes from a single, curated source of truth, so your team is always working with accurate numbers.
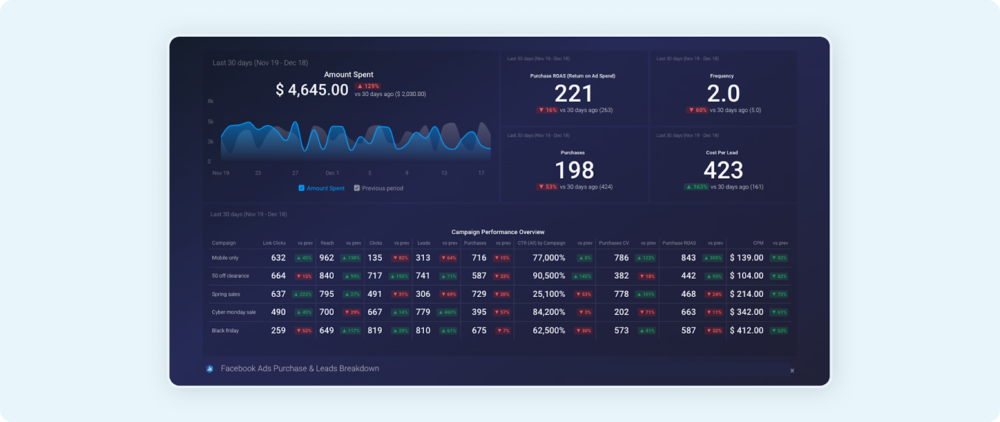
Visualize & Analyze Trends
Once you have your metrics, use Databox’s no-code metric builder to visualize them and uncover insights:
- Combine MongoDB data with CRM, marketing, finance, or operational metrics.
- Drill into row-level data directly from charts or tables.
- Filter dashboards by dimensions (e.g., region, campaign, product line).
- Compare performance across time periods.
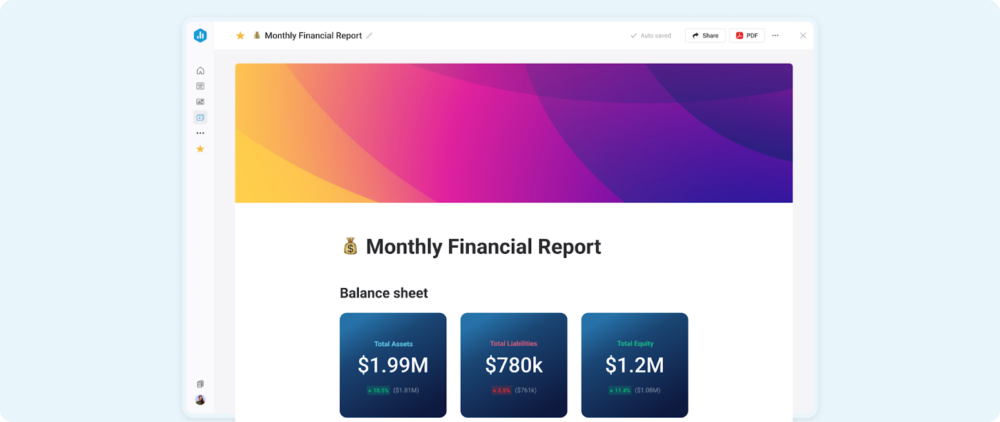
Build Reports & Automatically Deliver Performance Updates
You can also create comprehensive reports that keep your team and stakeholders informed. Add existing dashboards and metrics to provide full context, and use AI-generated summaries to explain performance in plain language.
Then, schedule reports to be delivered automatically, daily, weekly, or monthly, so the latest insights are always in the right hands at the right time.
Use Case: Visualizing Product Usage Events
Let’s say you have a MongoDB collection tracking every interaction with your product:
Collection: product_events
Right now, those records are just raw data. But with Databox, you can turn them into a live, interactive view of product adoption that your product managers, marketers, and execs can explore anytime—without writing a single query.
In minutes, you can:
- Connect your
product_eventscollection to Databox with read-only access—keeping your data secure. - Prepare your dataset by selecting
timestampandfeatureas fields, formatting them, and filtering out anything irrelevant.
Create your “Daily Feature Usage” metric to automatically count interactions for each feature by day. - Bring it to life in a dashboard:
- A line chart showing usage trends over time to spot adoption patterns.
- A table highlighting the week’s most popular features.
- Automated alerts whenever there’s a spike in usage after a new release.
Instead of sifting through JSON logs or running ad-hoc queries, your team gets a clear, visual story of how users are engaging with your product, helping you double down on what’s working and fix what’s not.


