Articles by Monise Branca
About the author
Product Marketing Specialist at Databox
Latest posts

Product Highlights: 2025 Year in Review
We introduced powerful new capabilities that make it easier for anyone on your team to access the data they need, uncover insights, and share insights across the business. Here are this year’s top highlights:

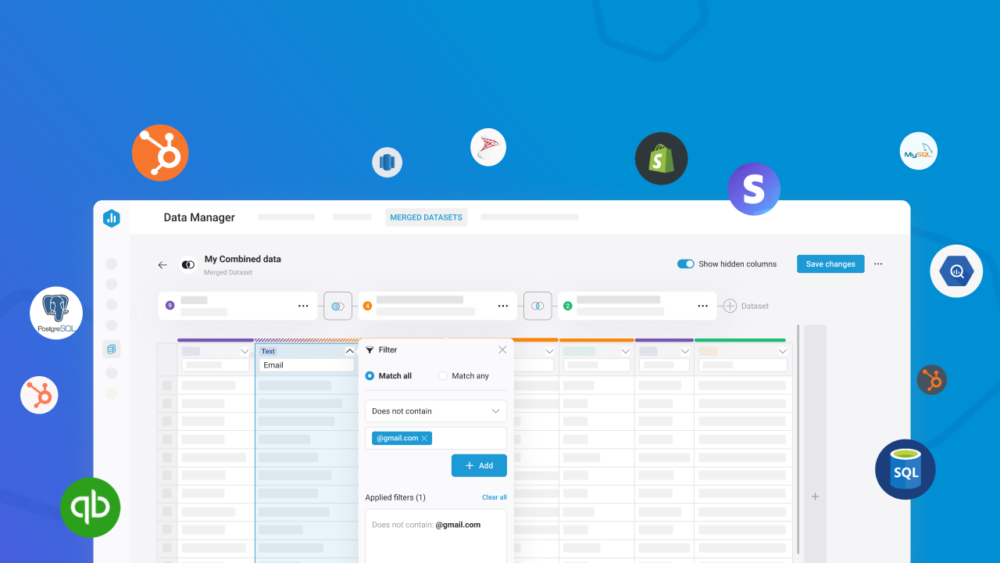
New in Databox: Sync Data From 350+ Tools With Dataddo
Sync structured, row-level data from 350+ tools into Databox and prepare it for analysis, so you can track more of your data in one place, build metrics that actually match how your team operates, and uncover insights you couldn’t see before.

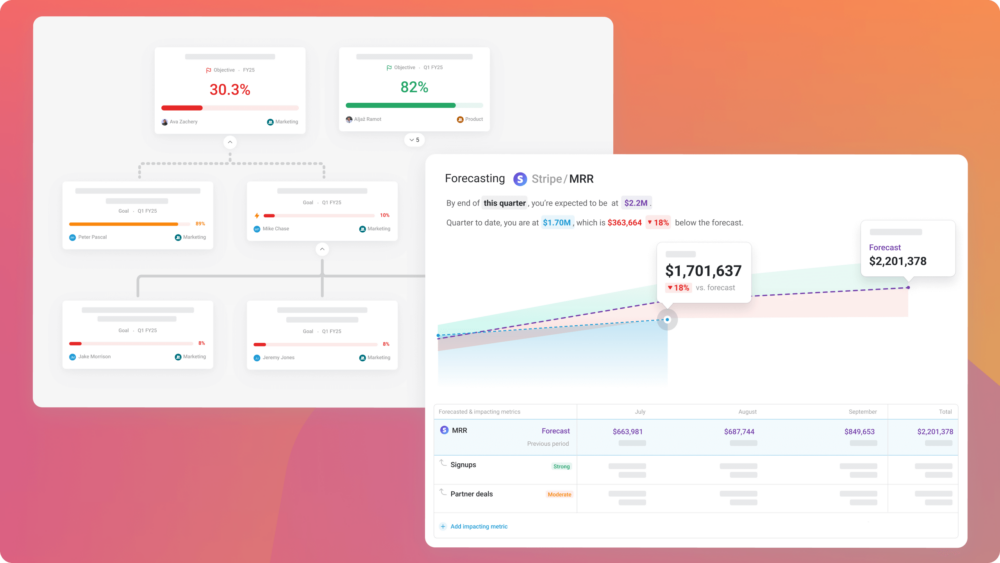
New in Databox: Build Annual Plans That Actually Work With OKRs and Forecast Modeling
Make annual planning measurable, adaptable, and grounded in data.

New Integration: Turn MongoDB Data into Beautiful, Actionable Dashboards with Databox
MongoDB is one of the most popular databases for modern applications. Its flexible, document-oriented model makes it easy for developers to store and query everything ...

New in Databox: Do Deeper Analysis & Improve Performance Faster with Our New Advanced Analytics Features
We've officially launched a powerful new set of advanced analytics features during our May 7th launch event. In case you missed it, here’s a quick recap of what we launched.

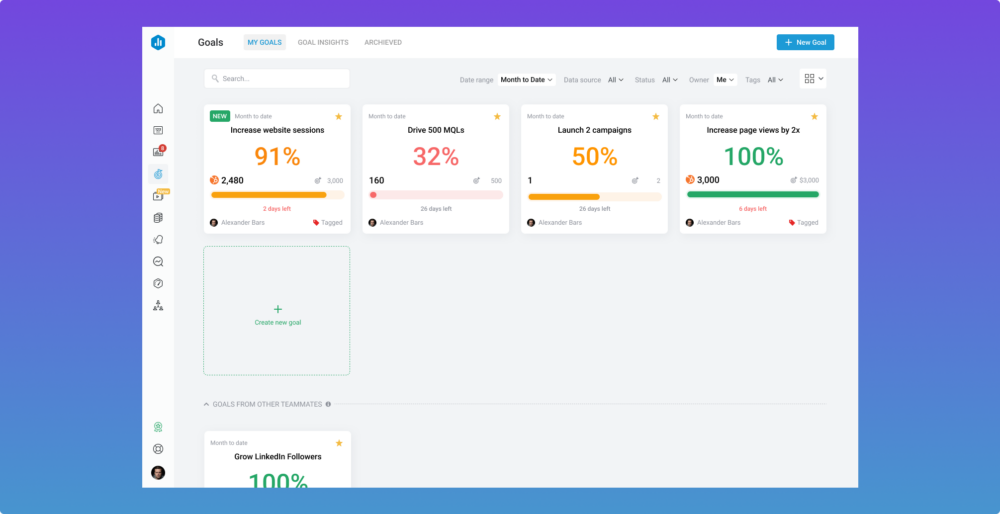
New in Databox: Track Success Your Way With More Flexible Goals
With our new and improved Goals feature, you can set, track, and manage any goal in your company

New in Databox: Give Teams the Answers & Insights They Need – Faster
Update (September 2025): We renamed our Teams feature to Spaces. Spaces better reflect how you’re already working and give you more flexibility to organize data ...

Product Highlights: Explore the Latest Features and Updates of 2024
Over the past year, we’ve been dedicated to making Databox faster and more powerful for you and your team. We’ve introduced new features, visualizations, and ...

Improvements To The Way You Connect Your Data to Databox
Release date: August 1st – August 9th, 2024 What’s Changing Let’s say you want to connect an Integration like GA4, and pull data from 3 ...
Subscribe to our newsletter, Move the Needle
Join more than 15,000 leaders who are learning how to make data a competitive advantage.
Make better decisions,
together, faster
Product
Compare
Databox Inc.
HQ: Boston, MA, USA
Modern BI for teams that needs answers now
Product
Compare


