


Table of contents
2025 was one of our biggest years yet.
We introduced powerful new capabilities that make it easier for anyone on your team to access the data they need, uncover insights, and share insights across the business —so decisions can happen faster and with more confidence.
Here are this year’s top highlights:
Prepare your data for analysis, without code
Create a reliable source of truth your team can use to explore performance and build metrics with confidence.
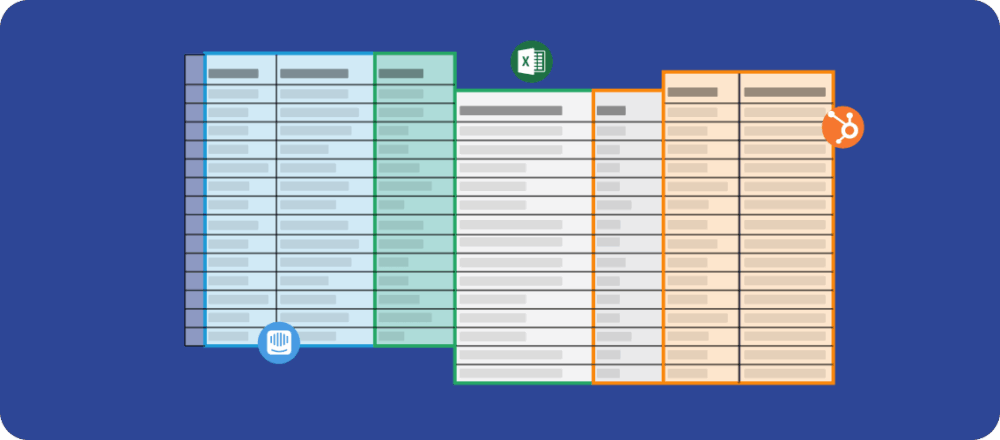
- Datasets: Build custom tables of raw data you can filter and standardize, then turn them into metrics your team can trust.
- Merged Datasets: Combine multiple datasets from different sources into one unified table, and use formulas to create new columns so you can build metrics with your exact business logic.
Answer your data questions, faster
Explore your data from multiple angles and get to the details that matter, faster.
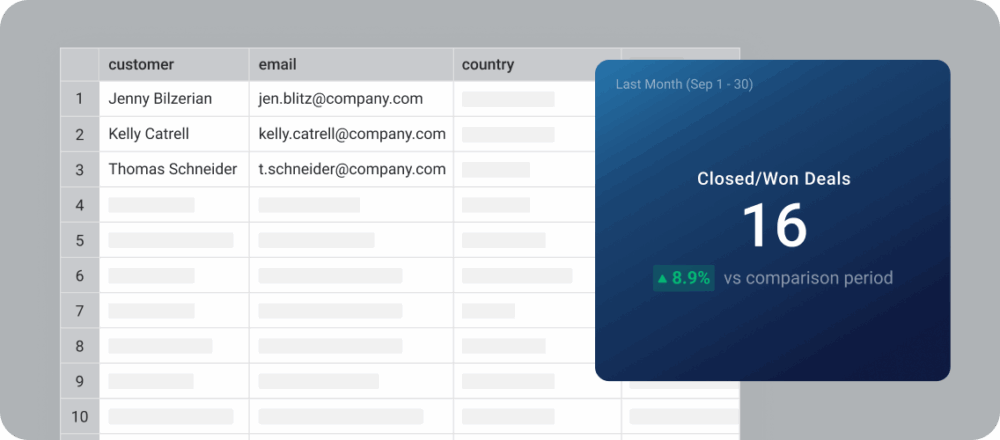
- Drilldown to row-level data: Click into any metric built from a dataset to see the raw data behind it.
- Advanced filters: Apply multiple filter conditions to your Databoards to explore performance across different segments and uncover insights more quickly.
- Color-coded charts: Enable color indicators for gauge and progress bars to quickly see whether you’re on track, at risk, or falling behind on your goals.
- Datablock Explorer: Expand a Datablock to explore a metric in more detail, so you can understand changes and identify trends.
Plan with more clarity and confidence
Build plans backed by data and keep your team focused and aligned, all year long.
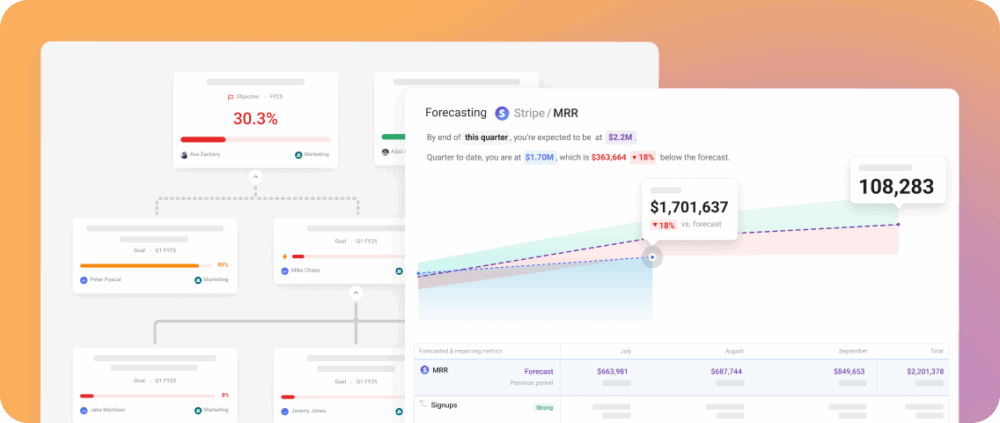
- OKRs: Define objectives, break them down into measurable sub-goals, and keep your team aligned and focused on what matters most.
- Forecast Modeling: Model different scenarios so you can test your assumptions before committing resources.
Explain performance clearly and drive better decisions, together
Explain what happened, why it happened, and what to do next, so stakeholders can easily understand performance and align on next steps.
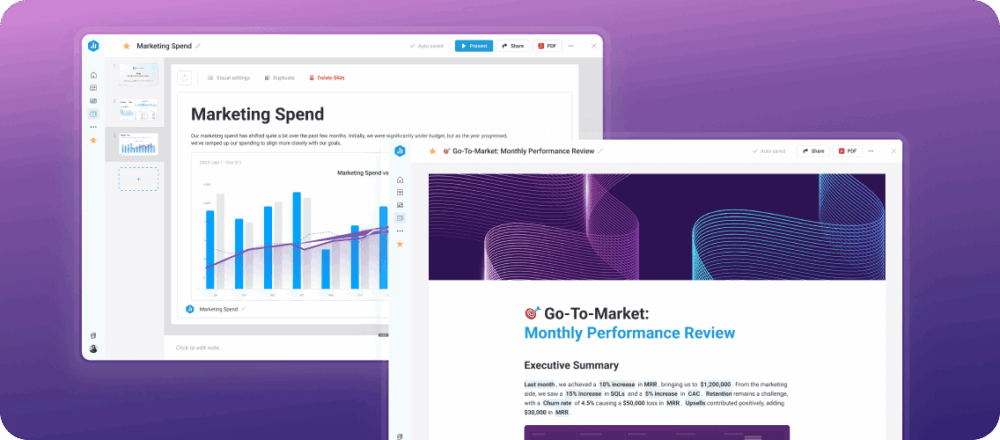
- Pageless formats: Create a scrollable pageless report, and switch formats anytime based on your audience’s needs.
- Presentation mode with speaker notes: Present performance confidently with full-screen slides and private notes that guide your discussion.
- Customization options: Add cover photos, tables, page dividers, backgrounds, and other styling elements to make your reports clearer, more engaging, and on-brand.
- Editable performance summaries: Edit your AI-generated summaries to add context, highlight key insights, and shape the narrative in your own words.
Keep your workspace organized and easy to manage as your team grows
Give your team a workspace that’s easier to navigate, maintain, and scale.
- Spaces: Organize Databoards, Reports, and metrics by team or function so everyone can quickly find what they need.
- Manage data sources & users from one screen: View and manage all data sources and users across your agency and every client account—from one place.
- Recover recently deleted Databoards and Reports: Find and restore Databoards, Loops, or Reports deleted in the past 30 days with one click.
- Default visualization settings: Save your visual settings as the default for new Databoards and Reports, so everything stays consistent and polished, right from the start.
Bring in any data, from anywhere
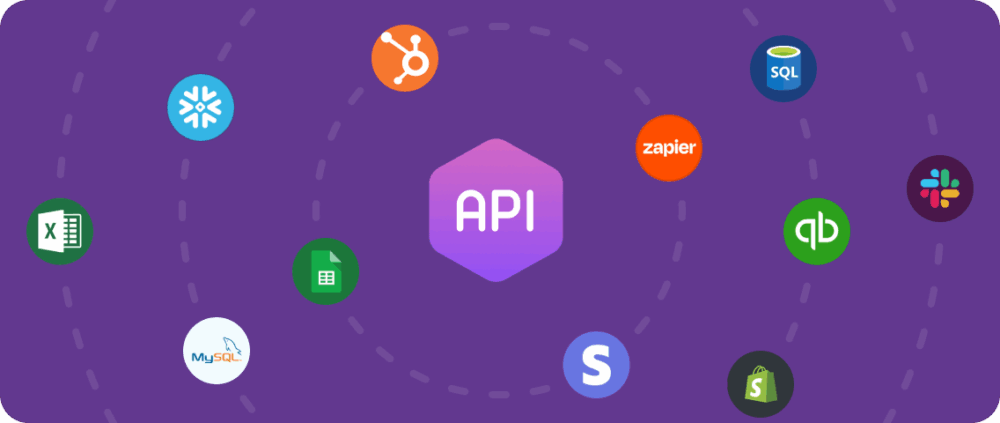
Sync data from more tools, warehouses, and custom sources so your team can get a complete view of performance and find insights you would have otherwise missed.
- New integrations: Connect Reddit Ads, Airtable, GoHighLevel, and more to visualize performance alongside your other KPIs.
- Databases & cloud warehouses: Sync data directly from MongoDB, SAP HANA, Oracle, Amazon Aurora, Google Cloud, Amazon Seller Central, and other enterprise systems to make your backend data accessible to the teams who need it most.
- New Ingestion API: Send structured, raw data from any source directly into Databox, so you can centralize more of your business data and help your team make faster, more informed decisions.
- Partnership with Dataddo: Sync and prepare data from 350+ tools for analysis, including Amazon Advertising, Monday.com, Adroll, Asana, and many more!
Get the guidance and support you need to improve performance

Access on-demand education and a growing community that helps you use data more effectively and level up how your team operates.
- Predictable Scale: A free, self-paced course that teaches you how to build a clear strategy, turn it into a practical plan, align your team, and use data to forecast growth and consistently hit your goals.
- Databox Community: A growing space where users, partners, and product experts can connect, share best practices, and learn from each other.
A look into 2026…
And this is just the beginning. In 2026, we’re bringing AI to the center of the Databox experience to make working with your data faster, simpler, and more intuitive.
From Genie, your AI Analyst, to a completely reimagined data connectivity layer through Databox MCP, we’re building a future where insights are always within reach.
Stay tuned!


