Table of contents
Whatagraph is a marketing intelligence and reporting platform designed for agencies and in-house teams that need cross-channel marketing reporting without the overhead of a full data team. With 50+ integrations, drag-and-drop dashboards, and client-ready branding options, it’s built to deliver polished reports quickly.
But speed comes with trade-offs: opaque, no self-serve trial, sales-led pricing, occasional connector glitches, and limits for teams that need SQL-level control or enterprise security.
This review covers Whatagraph pricing, features, pros and cons, real user reviews, and top alternatives so you can decide if it’s the right fit.
Who Whatagraph is best for
✅ Agencies that manage multiple clients and need templated, repeatable reports
✅ In-house teams that want polished reporting without hiring a data engineer
✅ Marketers who value branded dashboards and fast setup over deep modeling
Who Whatagraph is not ideal for
❌ SQL-first BI teams that need model governance
❌ Buyers who want transparent, fixed pricing
❌ Organizations requiring on-premise deployments or strict SSO/MFA by default
Key features
- Integrations: 50+ native (GA4, Meta, Google Ads, LinkedIn, Shopify, Sheets, etc.).
- Report builder: Drag-and-drop editor with reusable templates and widgets
- Data organization: Standardize fields, unify naming, and create reusable metrics
- Data blending: No-code joins across channels with custom formulas (ROAS, margins, etc.)
- Distribution: Scheduled PDFs, password-protected live links, automated delivery (scheduled emails) with optional review/approval
- AI features: Campaign summaries and a chatbot for data questions
- Refresh/sync: ~30-min updates
- Warehouse export: Native BigQuery bridge, plus Looker Studio connection
- Customization options: themes, custom domain, branded emails
- Security: TLS 1.2+, AES-256, EU data hosting, ISO 27001, SSO/SAML
Watch-outs and limitations
⚠️ Connector reliability: Occasional disconnects, re-auth prompts, and mismatched metrics
⚠️ Integration coverage: ~58 sources vs. 100+ at some competitors (notably lacks X/Twitter Connector including x/Twitter Ads)
⚠️ Alerts: Basic goals only; no anomaly detection
⚠️ Performance: Some reports lag under load; collaborative editing can glitch
⚠️ Export options: BigQuery is the main path; other warehouses limited
⚠️ Policies: Auto-renew contracts, 30-day cancel rule, non-refundable fees
Whatagraph pricing (2025)
Last verified: Aug 2025 • Sources used: official support/help docs, recent reviews & comparisons, customer anecdotes (2024–2025)
Whatagraph has moved away from publicly listed, low-cost monthly plans. Instead, it now runs on a high-commitment, sales-led model with pricing disclosed through sales calls or chat.
- Entry Plan: €7,500/year (~$8,150 USD) for 50 data connections, unlimited users/reports, onboarding, and support
- Enterprise Plans: $10k+/year for 100+ connections, advanced onboarding, dedicated CSM, and custom integrations
TCO considerations
- Cost grows with data sources, not seats
- Agencies can often manage it without a dedicated analyst
- BigQuery adds cost if exporting; native use is cheaper
- Expect occasional QA for connector health
- No free trials. Instead, prospects get a proof of concept late in the sales cycle

You can see that the entry package includes 50 data connections and no limits on reports, users, or workspaces.
If you need more connections, you’ll negotiate a custom plan, and costs rise with scale, especially for enterprise deployments.
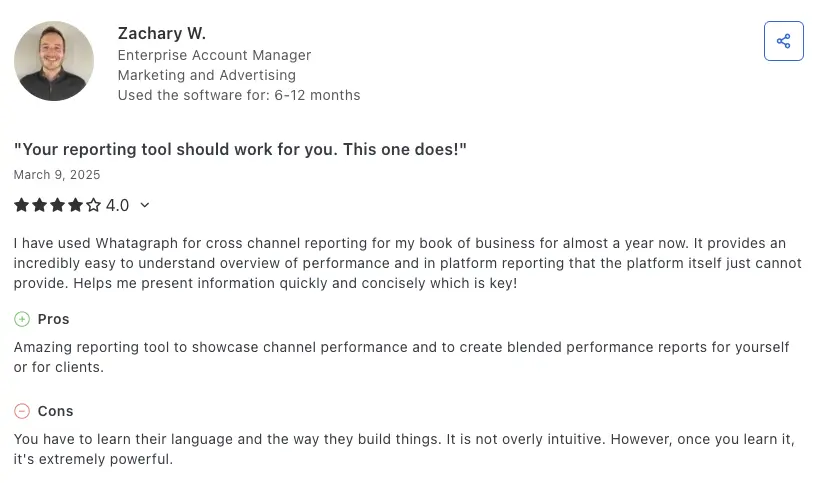
See what real users thought of their entry plan experience here.
Additional costs over time
Most agencies can run Whatagraph without an analyst; a marketer can handle setup and day-to-day use like connecting sources, choosing a template, and scheduling report.
However, total cost grows mainly with how many data sources you connect, not with how many clients you support or teammates who log in.
If you stick to native integrations only, extra tooling is minimal. But if you need to export data, you should budget for BigQuery (and possibly Looker Studio);
Expect light, recurring QA to catch metric hiccups and keep connectors healthy rather than ongoing SQL/ETL maintenance.
And remember, switching later will require recreating dashboards and templates in another tool.
One user summed it up simply: “As a solopreneur, I can’t afford Whatagraph long-term.”
The bottom line
Use Whatagraph if you need cross-channel, client-ready reporting fast, with strong branding and light-to-medium modeling. Skip or pair with a warehouse/BI stack if you require SQL-first modeling, strict model governance, or transparent public pricing.
Why you can trust this Whatagraph review
We work in this space every day. Our team of marketing analysts and BI engineers actively tests reporting platforms—not just as reviewers, but as builders of analytics software ourselves. That gives us a practical lens: does this tool actually make reporting faster, easier, and more valuable for businesses and agencies?
Independent, hands-on audit
We evaluated Whatagraph through multiple lenses: public demos, product documentation, help-center flows, and changelogs. Every claim in this review is cross-checked against reliable third-party sources and recent customer feedback.
Evidence over anecdotes
We don’t rely on single opinions. Vendor claims are verified in-app and in official docs. Only themes that appear consistently—across at least three independent reviews or threads in the last 12–18 months—are included as a pro or a risk.
Support tested beyond speed
Fast replies are only part of good support. We look at the accuracy and freshness of documentation, the transparency of status pages and release notes, and the consistency of help across chat, email, and community channels.
Scored against business needs
Our evaluation framework covers nine areas that matter most to agencies and growing businesses:
- Integrations & reliability
- Data modeling & blending
- Customization & branding
- Automation & scheduling
- Sharing & interactivity
- Security & governance
- Scale & performance
- Pricing & TCO
- Support & ecosystem
What real users say based on Whatagraph reviews
| Overall Whatagraph G2 Rating | 4.5/5 ⭐ | (277 reviews) G2 |
| Overall Whatagraph Capterra Rating | 4.4/5 ⭐ | (84 reviews; last updated Mar 16, 2025) Capterra |
Across G2 and Capterra, Whatagraph reviews follow a clear “yes, but” pattern—users praise its speed, clean visuals, and broad integrations, yet often flag price, connector hiccups, and customization limits in the same breath.
The deeper negative analysis confirms the same themes at a system level: high entry cost, data reliability issues, and limited scalability.
Whatagraph pros: What users love
✅ Quick to set up, easy to work in
Multiple reviewers say they were building client‑ready dashboards fast; several call the interface “intuitive,” “user‑friendly,” and “fun.”
Marcus S. says multi‑customer dashboards are “easy and fun,” while others love drag‑and‑drop widgets and ready‑made templates.
✅ Integrations + automation save real time
Users highlight pulling data from Google Ads, Meta, LinkedIn (even TikTok Ads) and more, then automating delivery—cutting manual reporting and human error.
One reviewer says they “no longer have to manually input data,” and another calls Whatagraph “our reporting tool… in practically real time.”
✅ Client‑friendly visuals
“Beautiful,” “very easy on the eyes,” and “professional” come up often; several agencies say the polish helps clients stay engaged and makes meetings smoother.
✅ Support & CSM shout‑outs
A common refrain: “exceptionally fast,” “lightning fast,” “stellar group of people.” Several call out their customer success manager by name for getting them up to speed.
✅ White‑label niceties
Some reviewers mention custom domains for a fully branded experience and even cite a 99.95% uptime “guarantee” they’re happy with—nice touches for client‑facing portals. (That claim comes from this user review, not official docs.)
Whatagraph cons: Where users hit a wall
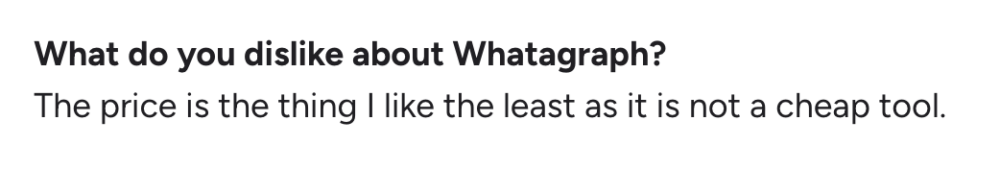
⚠️ Price adds up—especially as you scale
Even happy customers call it a “sizeable investment,” “not cheap,” or “expensive,” and a few compare it unfavorably on cost. Feature‑gating (white‑label, more sources, automation) is common behind higher tiers and can be a value mismatch for smaller agencies.
⚠️ Connectors occasionally misbehave
A recurring complaint: connectors disconnect “for no reason,” data occasionally doesn’t match the source, or certain metrics require manual workarounds. A 7‑day wait policy when reconnecting some sources is also painful on agency deadlines.
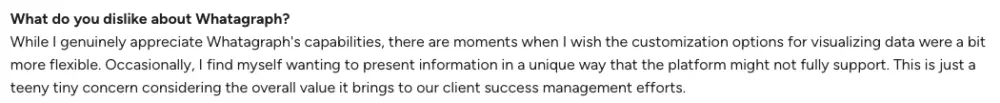
⚠️ Customization isn’t limitless
Several reviewers want more flexible layout controls, richer white‑label than “logo only,” proper section headers, and deeper control over widget size/placement. Advanced data manipulation and filtering can feel constrained for power users.
⚠️ Collaboration & performance quirks
One G2 reviewer reports widgets can “glitch or break” if two people edit a report at the same time; others mention occasional slowness or reports reloading mid‑presentation on shaky Wi‑Fi.
⚠️ Coverage gaps, data retention limits
A few call out missing/partial connectors (e.g., X/Twitter Ads support), plus short historical data retention—tough if you need YOY trend analysis inside the tool.
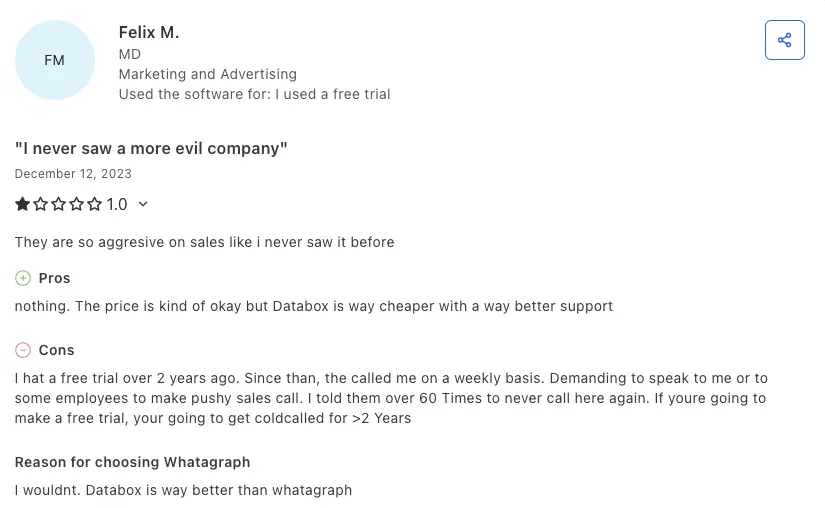
⚠️ Aggressive sales
One Capterra reviewer complains about aggressive sales outreach after a trial—clearly not everyone’s experience, but it’s in the record.
The “yes, but” pattern that is repeating across customer reviews
- Yes: fast setup, automated multi‑source reporting, lovely visuals, and helpful support… but price can sting as you add sources/users.
- Yes: lots of native connectors and sheets/API workarounds… but occasional disconnects or data mismatches mean periodic babysitting.
- Yes: easy to customize within templates… but advanced layout/branding and deeper transforms are limited vs. full BI stacks.
When you outgrow this tool, it’s worth turning to Whatagraph alternatives like Databox, which scale easily, offer built-in data prep, and provide far more connectors—fitting not just agencies but any team needing robust, cross-functional reporting.
Whatagraph setup & ease of use
In reporting, ease of use means how quickly you can go from a blank page to a polished report, how easily new teammates can jump in, and how simple it is to make last-minute edits before sharing with clients or stakeholders.
Capterra’s aggregate scores line up with this story: Ease of Use 4.3/5 (overall 4.4/5)
Are there ready‑to‑use templates and drag‑and‑drop?
Yes. Whatagraph leans hard on an intuitive builder plus a big template library. Their site and Help Center both emphasize drag‑and‑drop widgets, pre‑made blocks, and shortcuts to speed setup.
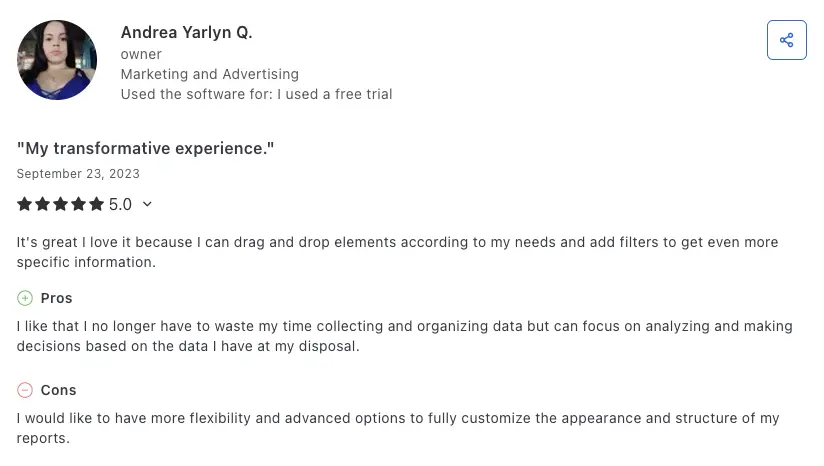
Real users echo that:
“I can drag and drop elements according to my needs and add filters to get even more specific information.”
On G2 you’ll see similar praise: “drag‑and‑drop widgets are so simple to use, they practically make the report FOR you.”
Is everything in one reporting environment?
Functionally, yes. You connect data, build, brand, and share inside one workspace—backed by a Help Center that maps the flow: Connect → Organize → Visualize → Share. That reduces context‑switching once you learn the menus.
How easy is editing dozens of reports at scale?
This is where Whatagraph shines for agencies: Linked Report Templates. Per the docs, “Linked reports are reports that are linked to a single master template, and any changes to the master template will automatically affect all linked reports.” Edit once; updates flow everywhere.
You can also create and save custom widgets for reuse to speed repeat builds.
What’s the practical learning curve?
Expect quick wins, then some “how do I…?” moments.
One reviewer notes, “In the beginning, it takes a lot of time to prepare your templates for the reporting.”
A few customization actions feel finicky on the canvas (e.g., layout precision), according to a recent third‑party review. And collaboration has an edge case: “If two people are editing a report at the same time, the widgets can glitch or break,” which is rough on tight deadlines.
Any “make‑it‑even‑easier” helpers?
Two nice touches: scheduled sharing/live links baked into templates, and an AI‑assisted widget creator (“draw‑to‑place” or prompt‑to‑build) to accelerate repetitive work.
Whatagraph is easy to start, efficient to reuse, and built for fast client reporting—though advanced users may need time for tweaks and to manage occasional collaboration quirks. If you’re looking for deeper customization and more advanced data preparation, Databox is often mentioned as a strong alternative.
Reviewers note there’s some upfront learning required with Whatagraph:
Whatagraph integrations
Reliable integrations are the backbone of accurate reporting—they need to cover all your key data sources, connect without hassle, and stay linked so your reports don’t fall apart at the worst moment.
How many out-of-the-box integrations does Whatagraph offer?
Whatagraph advertises 50+ native integrations spanning ads, social, analytics, email, e-commerce, and CRM.
Whatagraph’s agency and small business customers back this up by being happy with the list of supported integrations, especially with the big list of ad platforms. As a reviewer put it: “Ease of use, and big list of integration with ad platforms.”
Any notable coverage gaps?
A few users still bump into missing/partial connectors: among reviews they call out X/Twitter Ads. And for some clients, the lack of integrations is the difference in deciding not to purchase the platform.
Can you bring custom/offline data?
Yes, via three routes:
- Google Sheets integration for no-code custom data (hourly refresh (commonly used for gaps like TikTok metrics) ).
- Whatagraph Public API (push) to send any data you need into the platform
- BigQuery as both a source and a destination with scheduled transfers. Warehouse export to BigQuery exists but is gated to higher plans, per analysis
Reviewers call out Sheets/custom routes as genuinely useful for filling connector gaps.
Day-to-day reliability (the good and the gotchas)
Good: one G2 reviewer notes automatic alerts when a data source breaks.
Gotchas: others mention connectors that disconnect and occasional data mismatches vs. the source.
Whatagraph’s own Help Center flags causes like deprecated metrics and API quotas/rate limits (e.g., GA4, DV360), which can surface as widget errors until adjusted.
Bottom line
Expect ~40–50+ native connectors plus Sheets/custom API and BigQuery export. Setup is generally straightforward, but test mission-critical sources in trial and plan for the occasional reconnect or metric tweak due to upstream API changes.
Whatagraph data organization, filtering & blending
Clean reporting depends on how well you can structure sources, slice metrics, and join data without leaving the tool. Here’s how Whatagraph stacks up.
Data organization: sources, templates, and reuse
- Source Management: Assign sources to folders and tag them so the right accounts show up in the right client workspaces. You can also see where each source is used across reports.
- Standardize your fields: The Organize area lets you create custom metrics/dimensions (rename, describe, and reuse) so teams speak one metric language.
- Reusable building blocks: Build custom widgets and save them as templates; you can also merge reports by importing tabs to speed large builds.
One customer highlighted: “You can save everything for future use: report templates, widgets, custom metrics, filters.”
Filtering & segmentation: from widget to source level
- Widget-level filters support AND/OR logic and date conditions for precise slices.
- Source-level filters apply a rule across the whole report (less widget-by-widget busywork), and you can combine source + widget filters to refine further.
- Real-world note: reviewers like being able to set a specific date period that rolls forward each month for hands-off reporting.
- Gap to know: multiple reviewers/analyses flag limited or finicky filtering—e.g., pulling HubSpot email data but can’t exclude specific emails, which breaks certain client views.
Blending & calculations: cross-channel views without code
- Data Blends let you merge dimensions/metrics from different sources into a single, blended source; choose among four join types (full outer recommended for most cases).
- Custom formulas (ROAS, margins, etc.) can be created and reused across widgets and blends.
- Marketing-team friendly: Whatagraph’s own guidance positions blending as a no-code way to get cross-channel metrics in one place.
- Gap to know: deeper, multi-step transformations and complex multi-source modeling are not its strong suit—you’ll hit limits vs. full ETL/BI tools.
Bottom line
Teams value the organization, reusable components, and no-code filters/blends for quick, consistent reporting, but power users note filtering gaps and limited advanced transformations—heavy data prep may require external tools or trial validation.
Reports and dashboards on Whatagraph
Client reports aren’t just deliverables—they’re how your work gets understood, valued, and acted on. So the tools you use to build them need to balance speed, flexibility, and presentation.
Let’s look at how Whatagraph performs when it comes to creating, customizing, and sharing reports.
How are reports built (templates vs. custom)?
Whatagraph offers both ready-to-use templates and full custom report layouts.
You can start with a pre-built template for platforms like Google Ads, LinkedIn, or Meta—then customize it using a drag-and-drop editor. Or, build from scratch, widget by widget.
This flexibility helps avoid cookie-cutter layouts, though some users feel advanced customizations (like precise widget sizing or unique layouts) can be more limited than they’d like.
What can you actually customize?
Whatagraph goes much deeper than basic logo and color options. You can:
- Change titles, descriptions, and widget formatting
- Choose from 15+ widget types (gauges, stacked columns, pie charts, etc.)
- Adjust colors, fonts, icons, and currency formats
- Create new layout rows or tabs
- Add notes or custom branding per report
You can also save entire report templates and reuse them for new clients—without rebuilding them from scratch.
“Very customizable to make complex data easy to ingest for the client.”
— Patrick C., G2, March 26, 2025
Reports don’t feel locked to one design style, and you’re not boxed into a single layout like you are with some other platforms.
While customization covers most agency needs, a few reviewers call out superficial white-labeling and rigid layout constraints as pain points for highly bespoke reporting.
Are the dashboards interactive or static?
Whatagraph dashboards are interactive and meant to be explored—not just viewed.
Clients can click through tabs, view comparisons, hover over charts, and navigate multi-source reports easily. This makes it easier to share not just raw numbers, but clear performance stories.
You can also create multi-tab reports, so you’re not stuck loading all your data into one long scroll.
What are the sharing options (and how automated are they)?
Sharing is flexible. You can:
- Schedule automatic email delivery (PDF or live links)
- Share password-protected dashboards via URL
- Add optional review steps before the report sends
- Get email notifications when reports are delivered
When you update a dashboard, those changes sync to the report link automatically. No need to delete and re-add dashboards just to refresh data.
What about AI features for insights?
Whatagraph includes AI features on all plans that support it:
- An AI chatbot lets you ask questions about your data
- It can generate automatic summaries of campaign performance
- You can use it to highlight key changes or issues in your reports
This makes it easier for teams to spot trends and explain performance to clients without writing manual summaries.
“The reports are much more visually pleasing… and make report building an absolute breeze.”
— Patrick C., G2, March 26, 2025
Unlike tools that just generate a sentence or two, Whatagraph’s AI can actively help you build smarter reports.
The bottom line
Whatagraph delivers strong control over look, feel, and automation, making it easy to produce polished client reports.
Negative sentiment centers on limits in deep customization and occasional stability issues, which can frustrate power users aiming for highly tailored or collaborative builds.
Whatagraph security & privacy
When you’re managing client data, trust and safety aren’t optional. You need clear security policies, data controls, and privacy features that match how agencies actually work.
Let’s break down what Whatagraph offers.
How do they approach data encryption?
Whatagraph uses HTTPS encryption to protect data in transit, and they host data on secure cloud infrastructure. While they don’t publish a technical whitepaper, their Privacy Policy confirms that they “take appropriate security measures” to protect client data.
Their infrastructure is GDPR-compliant, and access to data is limited to authorized personnel only.
Are they covering GDPR basics?
Yes. Whatagraph is fully GDPR-compliant, including all standard rights under the regulation. This includes the right to:
- Access and download your data
- Request deletion or correction
- Be informed about how your data is processed
- Transfer data to another provider (data portability)
Source: Whatagraph Privacy Policy
This ensures agencies working in or with the EU stay aligned with data protection rules.
Can you control who sees what (role-based access)?
Yes. You can create different roles (Admin/Manager/Editor) for internal team members and clients, limiting access to specific reports, dashboards, and data sources.
Clients can only see what you allow them to see. You can also:
- Assign view-only roles
- Limit editing rights
- Keep sensitive performance data internal
Plus, you can add a password to any report shared via link. This gives you a simple way to lock reports—even when sending via email.
“We use password protection for client reports. It’s simple but gives us peace of mind.”
— From internal user notes, echoed in Whatagraph Help Docs
What about single sign-on (SSO)?
SSO is currently not confirmed as a default feature across all plans. If your agency needs enterprise-level login controls, you’ll need to ask their team directly during onboarding.
MFA (Multi-Factor Authentication) is also not advertised as a platform-wide feature, which may be a concern for large agencies with strict security policies.
Where might it fall short for enterprise teams?
Whatagraph checks all the basic boxes for encryption and GDPR, but advanced security features like SSO or mandatory MFA are not clearly listed or may be available only on higher-tier or custom plans.
If you need to enforce strict login policies across a large team, or if your agency works with corporate clients that require these standards, it’s worth confirming access to SSO and MFA during sales conversations.
The bottom line
Whatagraph covers essential security needs like GDPR, role-based access, and password-protected reports. But for enterprise-level teams that need SSO or MFA by default, there may be gaps unless you’re on a custom or premium plan.
Whatagraph support, SLAs & community
Software features matter—but when something breaks or you’re stuck, fast, reliable support can make or break your experience. So how does Whatagraph support hold up when it counts?
Is there a dedicated Customer Success Manager (CSM)?
Yes. Every Whatagraph plan includes a dedicated Customer Success Manager, no matter your size. Whether you’re onboarding your first client or managing 50, you’ll have a direct contact to help with setup, strategy, and ongoing support.
This is a major difference from platforms like AgencyAnalytics, where priority support or CSM access often requires paying for a higher-tier plan.
Is there live chat?
Yes, and users say it’s fast.
“Whenever I’ve had an issue, I can expect to have a proper conversation from within my dashboard in under 3 minutes of raising a ticket.”
— Brinda G., G2, March 28, 2025
Support is available directly within the platform via a live chat bubble. Most basic questions get answered in under a minute, and more technical ones are usually resolved the same day.
What are the other ways to get help?
Whatagraph also has a searchable Help Center with step-by-step articles, videos, and FAQs. For more in-depth needs, email and ticketing support are available too.
If you’re setting up a complex report, your CSM can even jump on a call or share screen to walk you through the process.
What are real users saying about their experience?
Across the board, user feedback is very positive—especially for agencies that value responsive, human support.
“They not only take continuous feedback and add new features based on it… one time they went way above and beyond for our agency and completely reworked their API.”
— Patrick C., G2, March 26, 2025
“There’s a level of dedication from the Whatagraph team that you don’t often experience anywhere else.”
— Kim Strickland, Peak Seven, from Whatagraph Customer Story
Several reviews also mentioned support as one of the platform’s most valuable features—on par with the actual product.
The bottom line
Whatagraph delivers standout customer support with fast live chat, hands-on onboarding, and a dedicated success manager for every plan. If support matters to your team, this is a major plus.
Some customers, however, mention slower response times from support:

Final verdict: is Whatagraph the right choice?
Whatagraph is a strong fit for teams that want fast, repeatable client reporting without heavy data engineering.
Choose Whatagraph if…
- You’re an agency reporting at scale and want Linked Report templates so one edit updates every client’s report.
- You need no-code data blending and custom formulas for cross-channel KPIs.
- You care about polished, on-brand reports and scheduled live links/PDFs (less time in slides).
- You value responsive, human support—case studies and reviews highlight quick, helpful help.
“It helped us not only get clients on board but also keep them within the agency.”
— Stef Oosterik, Dtch. Digitals (churn down 50% after adopting Whatagraph)
Choose Databox if…
- You want more native integrations and out-of-the-box customization (Databox markets 130+).
- You need no-code BI-style capabilities with data preparation, forecasting, and benchmarking.
- Mobile-first, live dashboards matter (solid iOS/Android apps for execs on the go).
- You plan to push custom data via a REST/Custom API alongside Sheets/DBs.
- You’re seeking budget-friendly entry—check current plans and pricing.
The bottom line
Pick Whatagraph for speed, brandable client reports, and at-scale reuse (linked templates + no-code blends). Choose Databox if you need a larger connector catalog, robust mobile access, and developer-friendly custom-data options.