


Table of contents
Analytics and reporting can help businesses transform data into actionable insights, identify customer behavior patterns, measure each department’s performance, and improve operational efficiency.
And this is just the tip of the iceberg.
However, while these two terms are often used interchangeably, they represent different approaches to understanding and communicating data.
Reporting involves gathering data and presenting it in a structured way, whereas analytics is using data to identify patterns and gain insights to inform future decision-making.
Think of it as a nurse (reporting) and doctor (analytics).
A nurse takes vital signs, records symptoms, and reports this information to the doctor. The doctor then uses this information to diagnose the patient’s condition and develop a treatment plan.
But how many companies actually know the difference between analytics and reporting? And do they have dedicated roles for both areas?
We conducted a survey with 22 respondents to find the answers to these questions (and a few more you’ll want to stick around for).
Let’s check it out.
- What is Analytics vs Reporting?
- Importance of Analytics and Reporting
- 4 Key Differences between Reporting and Analytics
- Streamline Both Your Reporting and Analytics with Databox

What is Analytics vs. Reporting?
Analytics and reporting both represent ways of understanding and communicating data, but they do it differently.
Reporting is the process of collecting data and presenting it in a structured and easy-to-understand manner, often in the form of charts, tables, or graphs. It’s important to have a well-defined process and present data accurately, to prevent any misinterpretations.
Reports usually provide information on past performances and KPIs like sales figures, website traffic, or customer demographics. Depending on what you want to focus on, there are several types of reports (e.g. financial report, sales report, marketing report, etc.).
This process allows stakeholders, executives, managers, investors, or regulators, to quickly and easily access and understand important information like financial results and operational metrics.
Analytics, on the other hand, involves using data to draw insights and make informed decisions. It goes beyond simply looking at what has happened in the past and instead aims to answer questions about why something happened and what might happen in the future.
Modern analytics tools also leverage complex data analysis techniques, such as predictive modeling, data mining, and machine learning, to uncover hidden insights and trends in the data. The purpose of analytics is to help managers and executives make informed decisions that will drive the business forward.
Related: Marketing Monitoring vs. Marketing Reporting: What Is More Important?
Overall, analytics answers why something is happening based on the data, whereas reporting tells what is happening.
Because these two terms represent different processes, companies should employ different people for both areas – data analysts and reporting analysts.
Build automated reports and make better decisions
Report what happened, what changed, then talk about what to do next.
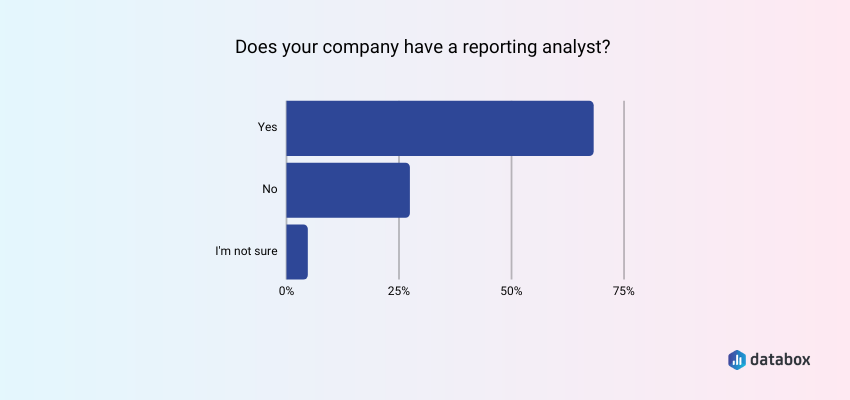
We asked our respondents whether they have reporting analysts in the company and most of them answered “Yes”.
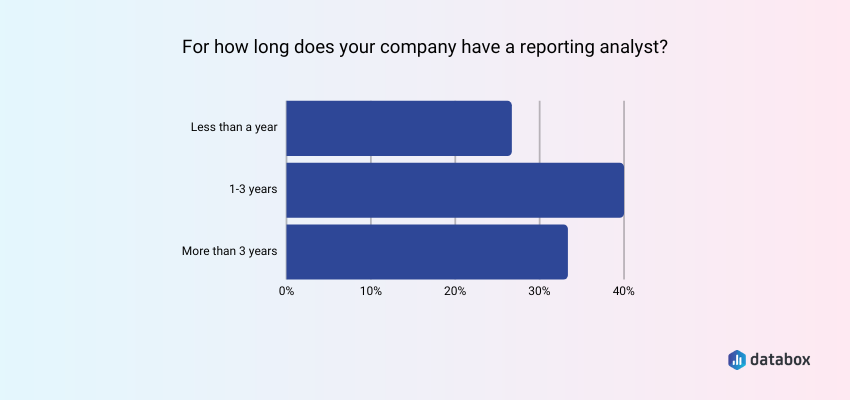
We also asked those who have reporting analysts about how long they’ve had them on the team. Most respondents have had them for between 1-3 years.
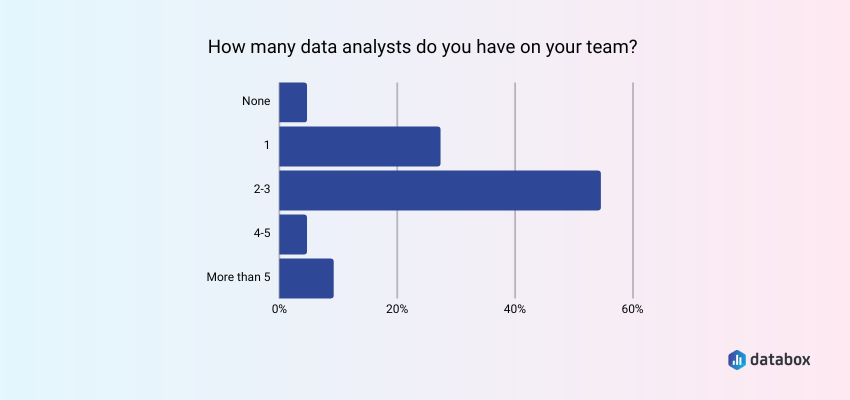
As for data analysts, most respondents have 2-3 data analysts in the organization.
Importance of Analytics and Reporting
Analytics and reporting both play a critical role in modern business operations.
Because of the vast amounts of data they collect, businesses need effective analytics and reporting processes to leverage the information and make strategic decisions. It helps them optimize operations, improve efficiency, reduce costs, and deliver better customer experiences.
Together, these two processes provide a comprehensive view of a business’s operations, and using only one of them can cost you relevant insights. Both are critical for businesses to thrive in today’s competitive environment.
4 Key Differences between Reporting and Analytics
We already touched briefly on some of the main differences between data analytics and reporting, but we also wanted to do a deep dive into each one individually and show you some interesting things our respondents pointed out.
The X key differences between reporting and analytics are:
- Differences in underlying purposes and use cases
- Differences in the way data is presented
- Differences in goals
- Differences in the process
Differences in Underlying Purposes and Use Cases
To begin with, analytics and reporting both serve different purposes. If you’re looking to get an answer to ‘what’s happening’ you need data reporting.
However, if you already have data reports (in simple words: organized and summarized data) and you need to find out the answer to ‘what now,’ you need to dive into analytics (and analytics dashboards).
Technically speaking, reporting is a subdivision of analytics and you can’t have analytics without reporting, but analytics goes a bit further and is generally a more complex process.
As VisualFizz’s Marissa Ryan puts it, “Reporting is simply a means of making an observation about an occurrence. While that, of course, is an important step, reporting doesn’t necessarily provide direction, guidance, or anything actionable.”
“Analytics looks at the incoming data reports, looks for patterns, delivers insights, and guides actionable marketing decisions,” Ryan explains.
In short, “reporting is for observation. Analytics is for actions.”
Looking at reporting and analytics this way shows us they’re dependent on each other.
If you want actionable insights or recommendations from raw data, you’ll first need to organize and format it – which is what reporting takes care of.
Similarly, reporting without analytics is useless at its core. Because then you have an idea of what’s happening based on the data gathered, but no way to interpret it into actionable takeaways to execute.
With this in mind, it’s apparent that their use cases drastically differ.
Sean Carrigan of MobileQubes adds that “analytics is useful for ad hoc interpretation of data to answer specific questions related to user behavior, trends, etc. so that improvements can be implemented.
Reporting provides data related to what is happening and is processed in a standardized format on a repeatable schedule… But it is only fully valuable when it is followed with proper and insightful analytics,” concludes Carrigan.
Related: Marketing Reporting: The KPIs, Reports, & Dashboard Templates You Need to Get Started
Differences in the Way Data is Presented
Since reporting is about formatting and making data easy to understand, it’s more presentation-oriented than analytics. It typically relies on showcasing data in charts, graphs, and other visually appealing formats.
The focus is on summarizing key metrics and performance indicators so that shareholders and managers can easily grasp the information. For example, a marketing report template that focuses on content usually tracks the most popular pages, dwell time, pageviews, pages per session, and other relevant metrics.
On the other hand, analytics outputs are generally in form of documented insights, recommended actions and strategies, forecasts, ad hoc reports, summary reports, and dashboards.
Eden Cheng from PeopleFinderFree adds that “reporting is utilized to drag details from the raw data, in the leading form of easy-to-read dashboards of valuable graphs. Therefore, via reporting, data is carefully arranged and summarized in seamlessly digestible ways.”
Cheng also mentions that “analytics is one step ahead of reporting and enables you to question and discover variable data.”
Difference in Goals
The primary goal of reporting is to provide a standardized, high-level overview of key metrics and performance indicators. It’s used to monitor the health of the business, track progress toward goals, and identify areas that may require further investigation.
On the other hand, analytics is focused on exploring and understanding data in greater detail to uncover insights and opportunities for improvement. The goal of analytics is to identify patterns, relationships, and trends within the data that may not be immediately visible in standard reports. Analytics tools are designed to provide users with the ability to ask more complex questions, test hypotheses, and gain a deeper understanding of the data.
Alina Clark of Cocodoc agrees and adds that “the goal of reporting is to change data from its raw form, which is unintelligible and hard to understand, into an easy-to-visualize format. The end result of any reporting system is to make the analysis as easy as possible.
At the same time, analytics churns through the data, draws out the problems, and provides the solution while at it. Any data analysis that doesn’t look at the three stages (problems-solutions-conclusions) fails to achieve the intended goals in most instances.”
Put simply, the goal of reporting is to organize and summarize data, while the purpose of analytics is to interpret it and deliver actionable recommendations.
Differences in the Process
Building a report and preparing for data analytics both involve a different step-by-step process.
To build a report, you need to:
- Outline the purpose of the report and the business requirement
- Gather relevant data from your different sources
- Translate the data into a format that can be analyzed and presented
- Develop and design a dashboard or report format that meets the needs of the audience
- Present the data in a clear and concise manner
- Provide real-time reporting
- Share the report with your audience and gather feedback
As for data analytics, the steps involved are:
- Define a problem and develop a data hypothesis
- Collect and clean data from relevant sources
- Develop and test analytical models to read the data and extract insights
- Use trend and pattern analysis, and data visualization techniques to communicate the results
- Make decisions and create strategies based on the insights and recommendations
Streamline Both Your Reporting and Analytics with Databox
Despite their differences, traditional reporting and analytics share two ugly truths: they’re time‑consuming and they make people’s eyes glaze over. Databox flips that script by turning scattered data into usable insights—fast—so everyone can act sooner and grow faster.
How it works in four quick moves
- Connect everything once
Plug in data from hundreds of native integrations—currently 120‑plus SaaS, database, and spreadsheet connectors—or push any custom dataset via our REST API. Databox Community - Pick the numbers that matter
Browse the Metric Library and drag‑and‑drop pre‑built, custom, or calculated metrics directly onto your canvas—no formulas, no code. - Visualize in seconds
Start from a blank canvas or any of the hundreds of ready‑to‑use dashboard and report templates to transform raw metrics into clear charts, tables, and “data stories” with just a click. - Automate distribution
Databox keeps every source in sync automatically and even lets you trigger manual refreshes before a big meeting. Pair that with Loops (rotating live screens), Scheduled Snapshots (auto‑emailed PDFs), and slide‑style Reports to keep stakeholders in the loop—without extra work.
Why teams love it
- Democratized speed – Real‑time answers on any device mean fewer “Can you pull that report?” pings.
- One source of truth – Centralize metrics, goals, forecasts, and benchmarks in one shared workspace.
- Headspace back for strategy – Let automation handle the busywork so your people can focus on decisions.
“Databox saves us at least two hours a month per client—and the mental bandwidth that goes with it. Automating reporting lets us spend that time on proactive work instead.”
— Dan Thomas, Lead Strategist, Digital 22 Databox
Community pro‑tip: Many users combine Loops + Scheduled Snapshots + Reports to build a fully hands‑off monthly reporting workflow that still feels personal and insightful. Read more in Databox Community
Stop letting manual reporting hold your business hostage. With Databox, you can centralize, visualize, and share insights in minutes—not hours—so your team can move faster and grow smarter.
Ready to see it? Build your first dashboard in five minutes or less.


