


Table of contents
What percentage of your website’s traffic comes from Google searches vs social media platforms?
How much traffic comes to your website from paid Google, Facebook, and Instagram ads?
What is your top converting traffic outlet?
These are just some of the questions that you can answer by analyzing your website traffic.
When you analyze your website traffic, you can make more informed decisions on what channels and campaigns to prioritize for your company’s marketing efforts.
In this post, we’re going to dive into how to identify, track, and analyze your top website traffic sources, including:
- What are the top website traffic sources?
- Source vs. Medium in Google Analytics: What’s the difference?
- How to track website traffic sources in Google Analytics
- How to track and visualize website traffic sources in Databox
- 15 things you will learn from analyzing your traffic sources in Google Analytics

What are the top website traffic sources?
It can help to think of your website traffic in buckets. Each bucket includes a specific type of traffic like organic, direct, referral, and social.
What is organic traffic?
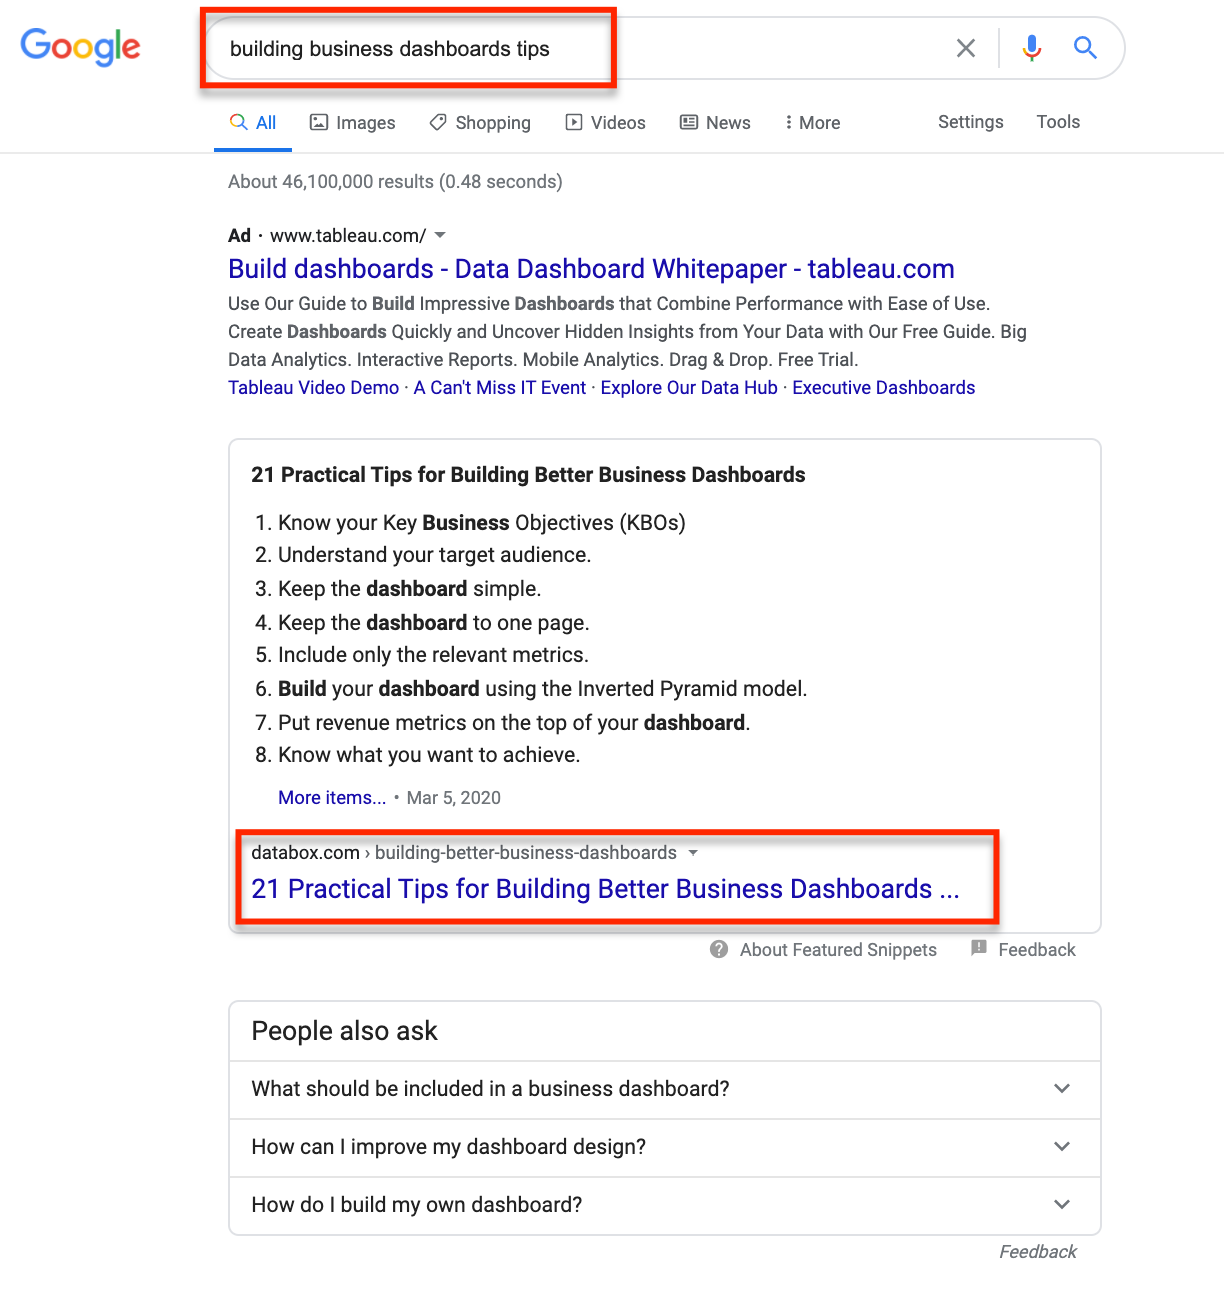
Organic traffic is loosely defined as any traffic that comes to your website from a search engine, such as Google, Bing, or DuckDuckGo.
For example, if you are searching for tips for building business dashboards in Google, and you click on a blog post to get 21 practical tips, this would be attributed as organic traffic in Google Analytics.
What is direct traffic?
Direct traffic is a bit of a catch-all in Google Analytics.
The majority of direct traffic happens in one of two ways:
- A visitor types your website URL in their browser
- A visitor visits your website through their bookmarks
For example, if I type databox.com in my browser, this would show up as direct traffic in Google Analytics.
However, organic search traffic can often be attributed as “direct traffic,” especially if a visitor does a search in incognito mode.
What is referral traffic?
Referral traffic is any traffic that comes to your website from an inbound link on another website that isn’t a social media site. This would be all blogs and news websites.
For example, if you get quoted with a link to your website in the New York Times, and people click on that link from the article, all of that traffic will show up as referral traffic from the New York Times in Google Analytics.
What is social traffic?
Social traffic is any visitor that comes to your website from links shared on social media platforms, such as Facebook, Twitter, Linkedin, Instagram, and TikTok.
For example, if you share a link to a blog post on Linkedin and 220 people click on the link, those 220 visits will show up as social traffic in Google Analytics.
Source vs. Medium in Google Analytics: What’s the difference?
It is really easy to confuse sources and mediums in Google Analytics.
Sources are defined as the original place where the traffic came from. For example, sources could be Social Media, Organic Search, Paid Search, Email, or a Referring Domain.
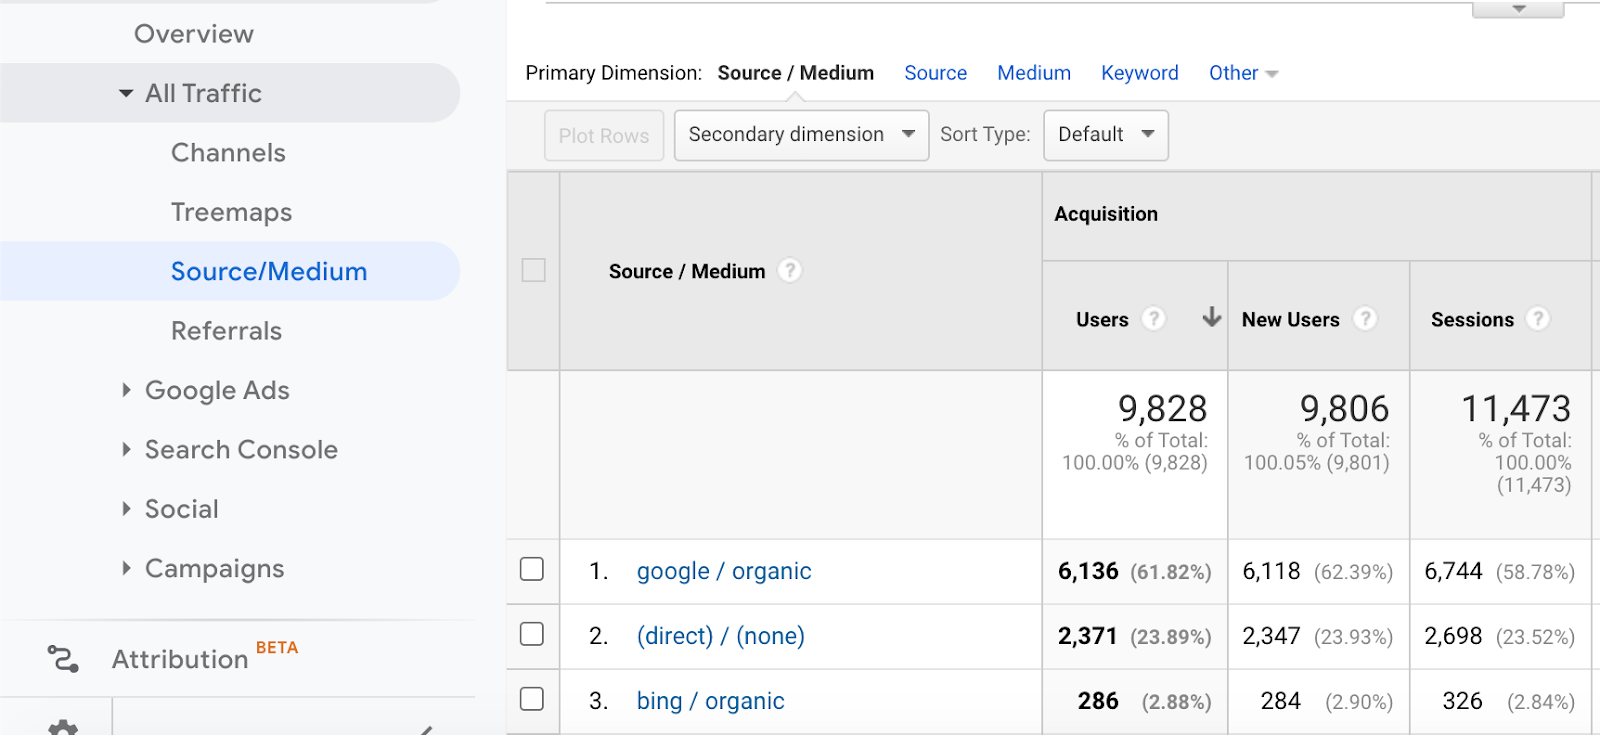
According to the marketers we surveyed, the top two traffic sources were organic search and direct.

On the other hand, Mediums are the general traffic type or category.
For example, Google traffic might be classified as “organic.” Paid Search might be classified as “PPC.” And, Instagram as “social.”
How to track website traffic sources in Google Analytics
The simplest way to track website traffic in Google Analytics is through the Acquisition Overview Report (Acquisition → Overview.)
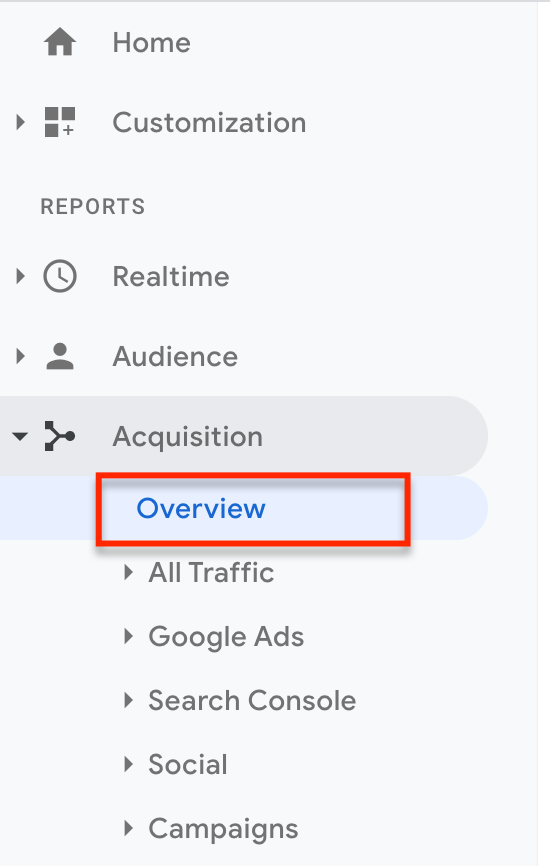
The overview report will allow you to quickly see the top channels, sources, mediums, and sources/mediums.
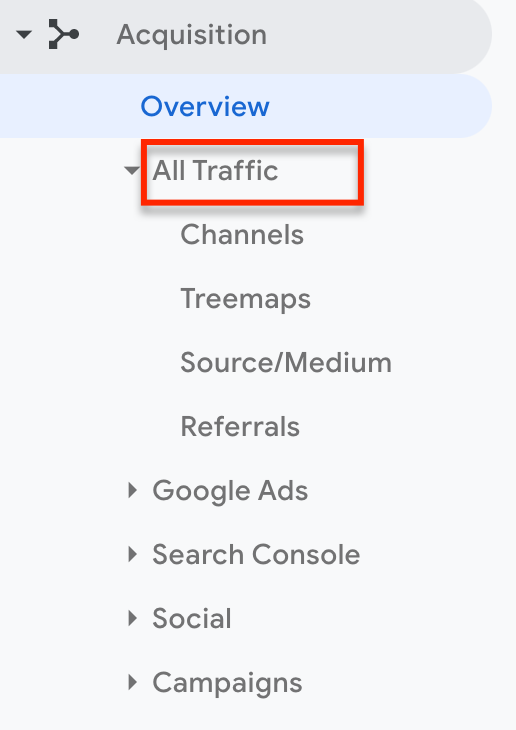
If you wish to dive deeper, you can do so by going to Acquisition → All Traffic. Then, you can visualize your traffic by channel, treemaps, source/medium, and referrals.
You can also segment and analyze traffic by Google Ads (paid), Search Console (organic), Social (social media), and specific campaigns (UTM tracking).
How to track and visualize website traffic sources in Databox
There are no shortages of ways of visualizing traffic sources using Databox. Below, we’re sharing some key metrics that you can track.
Sessions by channel
This is the number of Sessions during a specified date range split up by channels.
Using the pie graph visualization, you can see the percentage breakdowns for each channel. For example, 70% of traffic is coming from organic search.

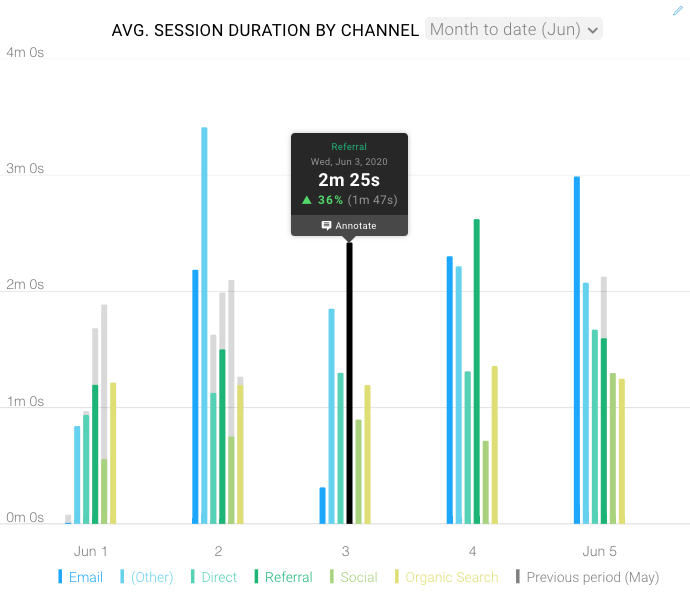
Average session duration by channel
This measures the average length of a session during a specified date range, split up by channel.
Using the bar graph visualization, you can see which channels are driving the longest and shortest sessions in a given week or month.
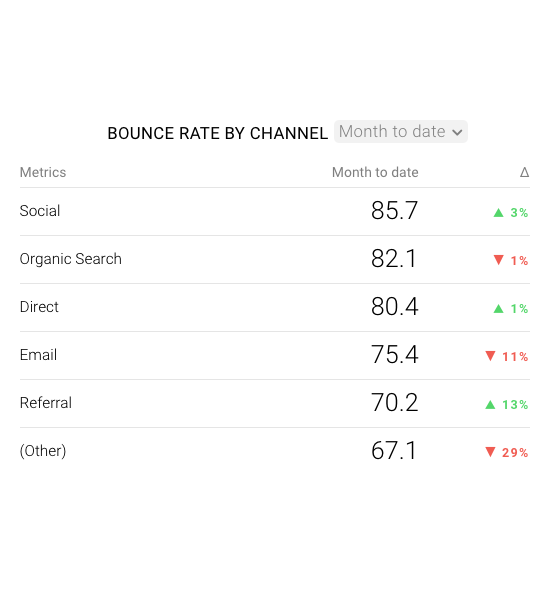
Bounce rate by channel
The bounce rate is the percentage of single page sessions in which there was no Interaction with the page during a specified Date Range. So, a bounced Session has a duration of 0 seconds.
When you use the table visualization, you can segment bounce rate by specific channels. This can be helpful to see which channels drive the most and least engaged visitors, which you can use to inform future marketing initiatives.
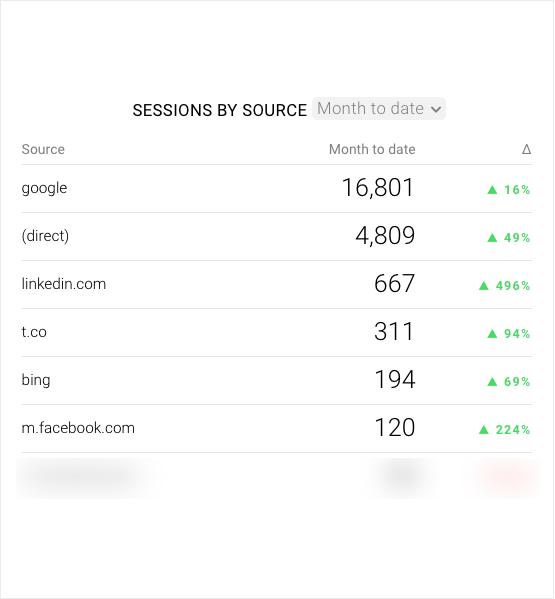
Sessions by source
This is the number of sessions during the specified Date Range split up by sources.
Using the table visualization, you can quickly see which sources are driving the most traffic to your website.
Users by source
Similar to sessions by source, you can also visualize the number of users who have initiated at least one session during the specified date range split up by sources.
Top Source/Medium by session
This is the number of Sessions during the specified date range split up by top sources/mediums. This is a great way to get a bird’s eye view of the impact of all of your marketing efforts.
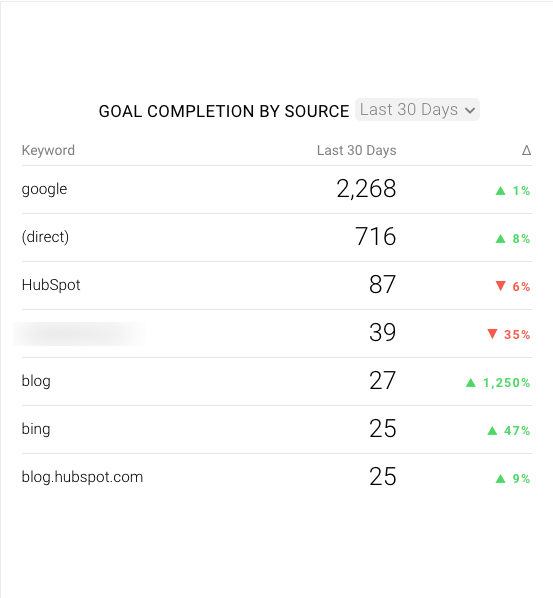
Goal completion by source
If you have goals configured, this is one of the most helpful metrics to track. This measures the number of goal conversions during the specified date range segmented by sources.
For example, if one of your goals is new email subscribers, you can use the table visualization to track the number of goal completions from each source. Then if you notice that Google is driving 3x as many conversions as other channels, you can double down on what’s working.
Goal value by source
Similar to goal completions by source, you can also track the value produced by goal conversions on your site during the specified date range split up by sources. This is particularly useful for measuring cost per lead and customer acquisition costs (CAC).
Top sources by revenue
This is the revenue from eCommerce or In-app transactions during the specified date range split up by sources. This is most helpful for eCommerce shops as they can quickly gauge which traffic sources are driving the most sales.
Transactions by source
A related eCommerce is transactions by source, which is the number of completed purchases on your site during the specified date range split up by sources. This gives you insight into the total number of transactions from each traffic source.
eCommerce conversion rate by source
Your eCommerce conversion rate is the percentage of sessions that resulted in transactions during a given time period. Just like with total transactions and revenue, you can also segment this by traffic source. You can use this information to identify and address any gaps in your acquisition and messaging strategy that is causing visitors to leave before buying anything.
15 Things You Will Learn From Analyzing Your Traffic Sources in Google Analytics
Once you start tracking your website traffic sources, you’ll be able to spot trends, identify new growth channels, and go after new marketing opportunities.
Here are 15 things you will learn from analyzing your traffic sources in Google Analytics:
- Inform your overall marketing strategy
- Track the success of existing marketing campaigns
- Analyze the impact of comarketing opportunities
- Gauge traffic quality
- Identify your top converting traffic sources
- Optimize your most profitable sources
- Monitor cost per lead over time
- Identify new referral sources
- Track your SEO efforts
- Compare traffic sources month over month
- Monitor the most engaging traffic sources
- Track how relevant your content is
- Keep an eye on bounce rate for each source
- Use the default channel grouping report
- Keep your biases and assumptions in check
Pro Tip: Your Go-To Dashboard For Doing a Deeper Dive on Website Traffic and Conversion Sources
Struggling to find an easy yet effective way to gain a comprehensive understanding of your traffic sources, user behavior, and revenue generation?
You can do all that and more with our plug-and-play GA4 Acquisition dashboard template:
- Understand user acquisition: See where users come from, tailor outreach, and track new user growth;
- Focus on high-performing channels: Identify top channels, optimize resource allocation, and adjust underperformers;
- Track revenue & engagement: Monitor revenue growth, active users, and the effectiveness of your campaigns;
- Go beyond traffic & conversions: Gain deeper insights into demographics, sales, customer journeys, ARPU, and more;
- Optimize marketing & drive results: Make data-driven decisions to improve your marketing strategy and achieve business goals.

You can easily set it up in just a few clicks – no coding required.
To set up the dashboard, follow these 3 simple steps:
Step 1: Get the template
Step 2: Connect your Google Analytics 4 accounts with Databox.
Step 3: Watch your dashboard populate in seconds.
1. Inform your overall marketing strategy
“By analyzing all traffic sources, one can determine the best strategy to work on their website,” says Carey Shook of The Turf Doctor. “For example, if paid search is down but organic traffic is up, you wouldn’t want to do an on-page keyword optimization focus—you’d want to analyze which campaigns are down and why. There is less wasted time when you analyze traffic sources and make educated, data-based decisions to address lower leads.”
Tzvi Vaknin of Ranky says, “Marketers can get the complete picture of where their efforts work better and where they waste their time & energy. Sometimes, there are lots of unexpected gems that bring traffic, even if you haven’t thought of them at the beginning (for example, your SEO efforts are around Google, but then you discover a nice increase in organic traffic from Bing).”
John Donnachie of ClydeBank Media adds, “The biggest insights we have gleaned from taking a broad view of our traffic sources were related to overlaps and interdependencies. ”
“Comparing landing page stats with email stats and organic search stats helped us identify keyphrases that were driving traffic to critical landing pages and the kinds of emails we should be sending to likewise encourage traffic.”
– John Donnache, ClydeBank Media
Chris Wilks of BrandExtract agrees, “One thing you can take away from analyzing web traffic sources is where you should allocate your time and effort.
For example, if you’re allocating lots of effort and budget to your paid search campaigns and you notice that it’s only responsible for a small amount of your traffic, then it might be in your best interest to shift that budget and effort toward something more effective.
On the flip side, if you’ve allocated a lot of resources to link-building efforts, and you notice that your referral traffic is gaining momentum, then it stands to reason that your budget is being well used and those efforts are worth continuing (or even investing more in).”
2. Track the success of existing marketing campaigns
“One invaluable insight is learning whether marketing campaigns are successful,” says Andrea Loubier of Mailbird. “If you can trace much of your new website traffic back to your latest guest post, or perhaps a quote from HARO or a survey, then you know that moving forward, it’d be wise to put more emphasis on that type of digital campaign.”
Christine Moley of Moley Marketing adds,“By analyzing website traffic sources a marketer can not only identify where their website visitors are coming from but how these sources interact with each other over the course of a campaign,” says “It is interesting to see where the traffic sources originated during the early days of a campaign and then see how those sources develop as the campaign continues to run.”
3. Analyze the impact of comarketing opportunities
“Off-site SEO plays a crucial role in ranking the website and generating the new traffic stream,” says Aqsa Tabassam of InsideTechWorld. “But, marketers should focus on qualitative links instead of quantity. You may get 10 links from sites having low traffic and see no encouraging increase in the traffic of your website as well. However, getting one link from the website with the massive readers can work like a magic formula in bringing noteworthy results.
These referral traffic stats tell you which type of sites to focus on in the future for co-marketing and guest blogging; otherwise, you may end up investing your time and energy pitching.”
Alistair Dodds of Ever Increasing Circles adds, “I love the source/medium report because it enables me to track how effective our content outreach campaigns are working. When considering content partners, I want to know that they have an engaged readership because I’m hoping to leverage some of that audience for ourselves as well as enjoy the SEO benefits of the link. So, being able to analyze the number of visitors from a given source lets me know whether to double down and really build on the newly established relationship with the publisher to help them and their audience.”
4. Gauge traffic quality
“I think the most valuable insight that marketers can learn is the quality of their traffic,” says Matthew Weiland of Uberflip. “It is only with clearly defined business and marketing goals that you can measure the quality of your traffic, which means a higher ratio of conversions and sales.”
Chris Harrison of Media Lounge says, “Understanding how traffic is reaching and interacting with your website is absolutely crucial in making informed business decisions, particularly in times like these.
If it’s clear that organic traffic is bringing in a significant percentage of your website traffic, it wouldn’t be wise to stop optimizing your metadata or deciding to abandon your content strategy. The same could be said of paid advertising – don’t sit back and think the job is done if you see some positive figures; do what you can to continue optimising your ads, reducing any wastage and growing your ROI.
If social media is generating a lot of traffic for your site, review your most engaged posts over the last few weeks – what are the similar themes amongst them? Is this something you could continue to replicate and/or expand on? If you can learn what types of posts work for your industry and which ones don’t, that could be the difference between a potential customer choosing your site over a direct competitor.
Ultimately if you can understand where your audience is coming from, you’ll quickly recognize the best way to position your site for maximum success.”
5. Identify your top converting traffic sources
Michael Roberts of P3 Practice Marketing says, “Understanding where getting the most traffic from is critical, but understanding where you’re getting the most converting traffic from is the real win. It’s easy to get distracted by the latest fad or even best practices. You want to be pushing more of your attention to the readers who need your content most.”
“By analyzing your website traffic sources, you can gain valuable insight into which traffic sources generate the best results in terms of your website’s overall conversion goals,” says Justin Blase of Ted’s Vintage Art. “Regardless of your conversion metric, if you analyze your goals by traffic source you can identify the valuable sources that should be scaled where possible, and you can also identify the poor performing sources that should be deprioritized or ignored.”
Jeremy Johnson of Seriously Smoked says, “In doing so, you can tell which traffic sources you can focus on and which to avoid. When marketers successfully determine the top two or three sources with the highest ROI, future marketing campaigns will focus more on those sources to increase your overall ROI.”
Meg Marrs of Safer Senior Care adds, “An important insight marketers can discover by taking a closer look at their traffic sources is deciphering which traffic sources convert the best. This can mean learning which traffic sources are most likely to make a purchase, which traffic sources make the highest-value purchases, or even which traffic sources are most likely to sign up for your email list.
Understanding how different traffic sources engage with your site allows you to find your most valuable traffic sources and double down on those sources, investing more in advertising on those mediums to help you get the best, most high-converting audience possible.
You can also examine which traffic sources convert the best and then look for similar traffic sources. For example, if you find that users that come from the Pinterest platform convert more than other social media networks, you may want to see if you can identify what Pinterest’s main audience is (mostly women), and then look for other networks where that demographic may spend time.”
For example, Jakub Rudnik of Shortlister says, “One specific learning is how organic and PPC interact. Marketers need to be aware of whether they’re targeting keywords for PPC that they already own via search results. If organic traffic falls as PPC increases, it could be a cannibalization issue.”
Morgan Taylor of LetMeBank agrees, “If you analyze your traffic sources, you will find where your traffic truly comes from. You could be paying thousands for your ads, but really all of your traffic is organic search traffic. By monitoring your traffic you aren’t guessing, you know what works.”
Matt Bentley of Loop Horizon adds, “This is only at a last touch level, so we will want to investigate other attribution models / conversion paths before taking any key decisions from this.”
Tony Mastri of MARION Digital Marketing explains, “If you’re using Google Analytics, Acquisition > All Traffic > Source/Medium is a great report for analyzing your traffic sources. Click the Goal Completions column to see which source accounts for the most conversions.
Many times, it will be google/organic or google/cpc that accounts for most of your conversions. However, you might find some surprises here. Maybe a complementary industry player mentioned you on their site, and you’ve received several calls and form submissions as a result. You could reach out and brainstorm ways to amplify that partnership.”
6. Optimize your most profitable sources
“Analyzing your website’s traffic sources helps business owners and marketers understand which sources are most impactful and profitable,” says Taylor Flynn of Parkway Digital. “For example, maybe organic traffic delivers the most email signups and email marketing delivers the most sales. Without traffic source data, you wouldn’t be able to measure ROI for investment in those channels.”
“Analyzing your website’s traffic sources helps business owners and marketers understand which sources are most impactful and profitable.”
– Taylor Flynn, Parkway Digital.
Colin Mosier of JSL Marketing & Web Design says, “One insight you can gain from analyzing your top traffic sources is that you can determine where your top potential revenue sources are. For example, if you analyze your traffic and find that a large percentage of your traffic comes from social media (and they become paying customers), you probably want to devote a bit more time and resources to your social media campaigns. This has the potential to increase your revenues even further. On the other hand, if you see that you are spending a lot of resources on an area that is not bringing in leads, this tells you that you should either decrease your resources toward that area, or you should make some serious changes to strategy.”
David Bokman of Philly Home Investor adds, “Probably the biggest most obvious insight you can gain from analyzing your traffic sources is to learn which channel is paying the most dividends. It can help you identify which channels are performing poorly, so you can decide to spend less effort on them over time. But maybe something more important is showing you certain channels that you didn’t invest much effort in, and didn’t expect to yield any benefits, but that are still sending traffic. For example, maybe you didn’t think your ideal audience was on Instagram or LinkedIn, and you only invested in organic search or paid channels. If you see that social is the 2nd or 3rd largest source of traffic for you, you’ll be able to decide if you want to increase efforts there to yield more from it. For example, our site ranks in the top 3 results for most of our target keywords. You’d think that organic search would be our largest channel, but according to Google Analytics, it’s actually Direct.”
7. Monitor cost per lead over time
“The most important view is the cost per conversion per traffic source,” says Tom Walsh of Kingpin Private Browser. “It will give you the best insight on what traffic source you should focus on. With a bit of math, you will clearly see what is the return on investment. Let’s imagine you are spending the same amount of money on paid search and building your content. And you can see from the report that your cost per conversion is 40% lower on paid search. That means that you might have still some space to increase your spend on paid search campaigns – in case you are happy with the overall price of conversion.”
Fran Nagaro of Rentiner adds, “It’s always tough to choose only one insight, I tend to review many aspects of the web on a daily basis, but if I have to choose I’ll stick to how my CPL (cost per lead) is evolving through the different marketing channels. Controlling and seeing trends in costs makes us change small aspects of campaigns and help us optimize to be more profitable.
Not all traffic sources have the same costs, and also they don’t generate the same quality of leads. In our car renting startup (rentiner.com) I can say that organic and paid generates more quality leads. Our business has a peculiarity: not everyone who wants a renting can access it because it does not meet the financial profile that renting companies require (as many financial products like loans or mortgages). That means that although the acquisition in paid search is more expensive, the ROI is higher than in other channels like social or display.”
8. Identify new referral sources
“Marketers can use traffic source data to identify new referral partners,” says Bruce Hogan of SoftwarePundit. “Using Google Analytics, marketers can use the Referrals report to see specific websites that have brought them web traffic. This information will help marketers learn what other companies are talking about their website, as well discovering newly gained backlinks.”
Brian Casey of IMPACT adds, “One of the big picture items that marketers always want to know, but rarely can figure out is: where are my ideal buyers spending time outside of my website? By analyzing the websites that are generating not only your referral traffic but referral traffic for your competitors, you can figure out where they spend time learning and evaluating. Organic search is a great entry point for prospects who may not know about your offering, but referral traffic sources bring some associated trust and less disruption to a buyer’s pre-existing research process.”
9. Track your SEO efforts
“When analyzing traffic, it’s important to see how many visitors are coming from the results of a direct search,” says Chris Gadek of AdQuick. “As we write our on-page content, we keep certain keywords in mind, so that we can begin to rank higher for them. If those keywords aren’t performing as we’d hoped, then we can make changes from the data derived from analyzing website traffic.”
Or, Amelia Whyman of Global App Testing says, “If your organic traffic is majorly dropping, you might want to investigate what the cause is. Perhaps you have been penalized by Google for an unnatural link, or a change you made to a high performing page hasn’t pulled off like you thought it would. Whatever the cause, organic traffic is very important in flagging up potential issues.”
David Walter of Electrician Mentor adds, “One great thing marketers can learn from analyzing their website traffic sources is the use of organic search and also, which keywords were used.. So basically, organic search means that a viewer accessed your website by going to say Google and typing in a particular keyword. What can you glean from that? Well, one piece of information would be that the viewer did not previously know about your website and only found it through a generic search. The next really great thing you can learn is which keywords are driving more viewers to your site. This can play a huge role in your content marketing strategy, as one brief example.”
For example, Rick Wallace of Tackle Village says, “In our business – a fishing content site – organic search for various fishing-related terms is the key source of traffic. The single most relevant insight we gain from analyzing our website traffic is the search terms visitors use to reach our pages as this helps us see which keywords deliver the most commercial traffic to the site.”
10. Compare traffic sources month over month
“I love to see what percentage of total website traffic came from which source and compare to the previous month to see if New Users from that source/medium grew,” says Bailey Hahn of Summit Digital Marketing. “I also study the Behavior report for New vs. Returning visitors to see how many times it takes someone to become a lead on a site,”
Matthew Rogers of Mango Matter adds, “I like to look at month-on-month or year-on-year segments of traffic sources to get a better understanding of how our marketing efforts are translating to pageviews across time. I prefer YoY as it tends to give me a more objective perspective of how we are performing across time as it removes the seasonality factors. For example, comparing traffic metrics in January versus December of the previous year is always going to be skewed. Therefore, I will look at how we performed in January of the current year versus January of the previous year. By using this filter, I can determine how different sources have performed in a more controlled environment.”
11. Monitor the most engaging traffic sources
“Analyzing website traffic sources let us know a lot,” says Nitin Vasu of Growth Blogging. “One great insight marketers can learn from it is that they can know where their content is getting more attention and they can work on that platform more to increase the website traffic.”
Ney Lins adds, ”Quality over quantity. Check the sources that drive more time spent and page views by the user. If you look at the sources only by considering the numbers of users brought by the sources you may have problems with identifying the most important source.”
12. Track how relevant your content is
“The one insight marketers can learn from analyzing their website data, if they cannot look at anything else, should be relevancy,” says Alissa Pagels-Minor of VoiceBase. “If your content and user experience is great, you will see higher page view times, lower bounce rates, and improvement in organic search performance. So the ONE insight should be: Are you providing your visitors with what they want and need?”
13. Keep an eye on bounce rate for each source
“I always look for bounce rates from specific traffic sources,” says Sunil Bishnoi of 29i Technologies. “For example, what is the Google organic traffic bounce rate, and by analyzing that I plan an SEO strategy to improve the bounce rate.”
14. Use the default channel grouping report
“We track our online store with Google by optimizing the Default Channel Grouping and ensuring referrals are in the correct category,” says Brandon Chopp of iHeartRaves. “We receive traffic from a wide range of sources and the Channel view aggregates our data to give us a broad view of each channel. We’ve been focusing on increasing our marketing efforts on social media and the Google Analytics’ Channels has helped us track our Paid & Organic Social channels easily and effectively.
15. Keep your biases and assumptions in check
“When we look at our statistics, we learn to recognize patterns and emerging trends related to our website,” says Willie Greer of The Product Analyst. “It’s important to know how people are finding us, and their behavior when they found us too. Most of the time, when analyzing data with a business dashboard software, our expectations are different from the reality of things. So with the numbers clearly on the board, we know where to focus our financial assets and where not to. We see opportunities for growth as well.”
“It’s important to know how people are finding us, and their behavior when they found us too. Most of the time, when analyzing data, our expectations are different from the reality of things. “
Willie Greer, The Product Analyst
In sum, one of the quickest ways to improve your website is to track and analyze your traffic sources on a regular basis. Then, use these findings to run experiments, whether that’s doubling down on a traffic source that is converting above average or making tweaks to improve a source that has low engagement and high bounce rates.


![How to Leverage Your Website Analytics to Acquire New Customers? [Research Findings Based on 100+ Companies]](https://cdnwebsite.databox.com/wp-content/uploads/2022/10/10044001/google-analytics-4-metrics-and-dimensions-guide-1000x563.png)


