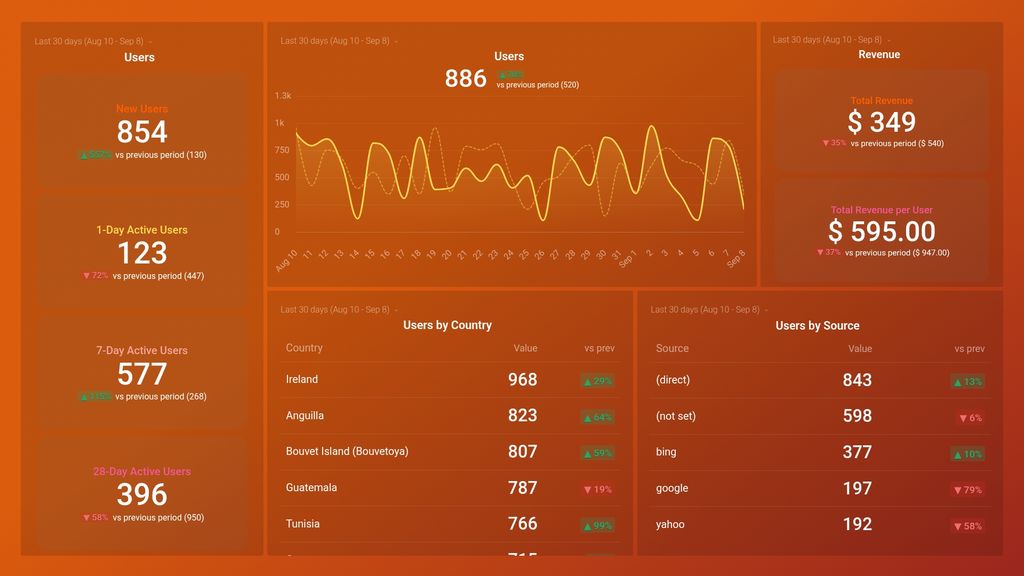
What you’ll learn from this Google Analytics 4 Traffic Acquisition Dashboard Template:
By connecting your Google Analytics 4 account, you’ll learn:
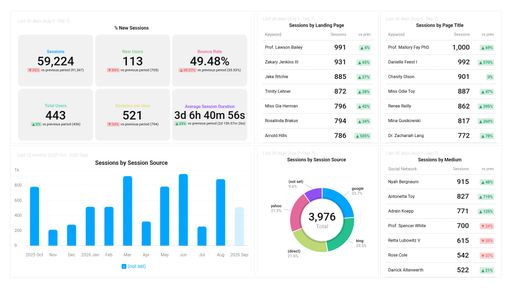
- Where are your website and app users coming from? By mapping out your customers, you're able to adjust your outreach strategy and determine which tactics are working with a specific demographic. This enables you to create more targeted, personalized campaigns that drive increased interaction with your brand.
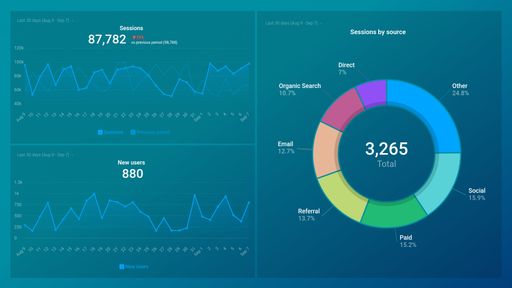
- Which channels drive the most traffic? Stay focused on the marketing channels that are actually driving results and make adjustments to ones that might be underperforming. Learn which channels require more resources and which require more support in order to turn performance around.
- How many new users are visiting your website and/or app? Track how many new users your website or app is generating during any given time period. Compare current performance to ones in previous months to measure and report on your audience growth and make adjustments when they matter most.
- How many unique users initiated sessions on your website or app? Discover the number of unique users who actively interacted with your website and/or app in a given time period to better understand whether or not your campaigns are driving new users to the website.
- How much revenue was generated? See the amount of revenue you generated in a certain period in time. Compare it to previous periods, make sure you're acquiring new customers, and that conversion rate numbers keep growing. By checking your total revenue regularly, you’re able to react at the right time.
What else can you track and visualize with our deep integration with Google Analytics 4?
When it comes to attributing to your traffic and conversions, almost anything:
- Traffic and lead demographics
- Sales revenue
- Mapping out the customer journey
- Calculate average revenue per user/ARPU
- Website and app engagement
- Purchase paths of your users
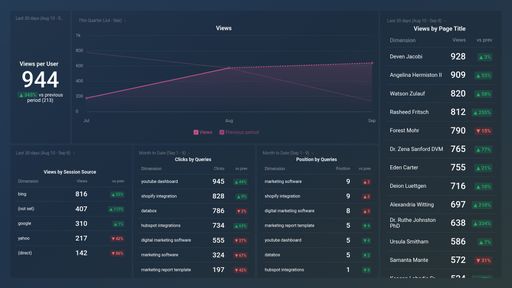
- Landing page performance
- Monitor audience growth over time.
There are many, many different metrics and metric combinations you can track using Google Analytics 4. And in Databox, you can quickly visualize 100s of Google Analytics metrics in a variety of different ways.
Read more about Databox’s Google Analytics 4 integration.