Uses one-click integrations:
-
 Google Analytics 4
-
 HubSpot Marketing
If you don't use Google Analytics 4 or HubSpot Marketing, you can pull data from any of our 130+ one-click, native integrations or from spreadsheets, databases and other APIs.
Try this dashboard for free
HubSpot Marketing metrics included in this template
- New Leads Goal (Goal)
-
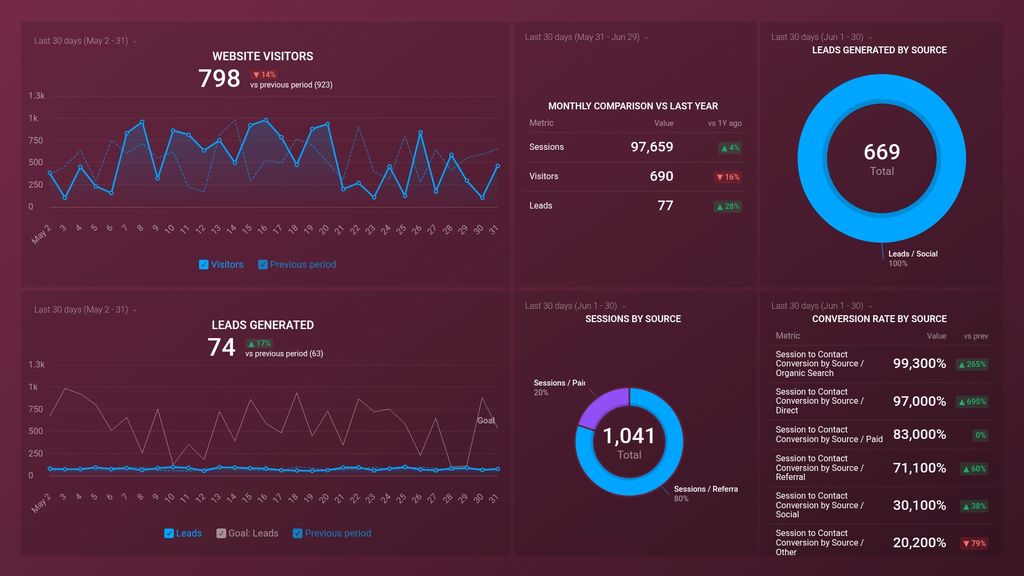
New Leads by Source
New Leads by Source metric measures the total number of new leads generated from each source, allowing businesses to identify the most effective channels for lead generation and optimize their marketing efforts accordingly.
-
Session to Contact Conversion by Source
The Contact Conversion Rate by Source metric in Hubspot measures the percentage of website visitors who become contacts, sorted by the source of their visit.
-
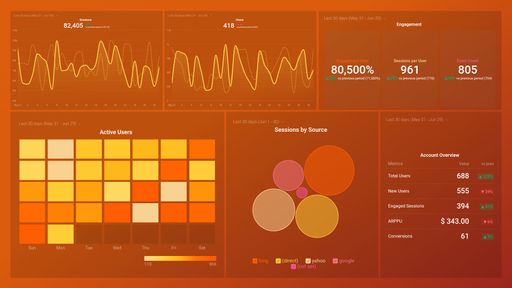
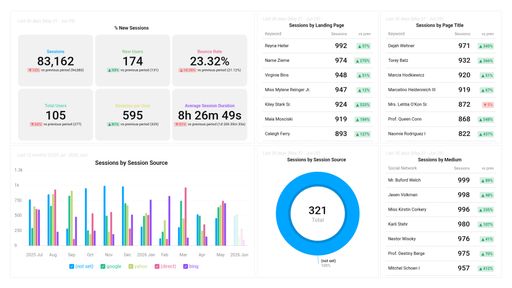
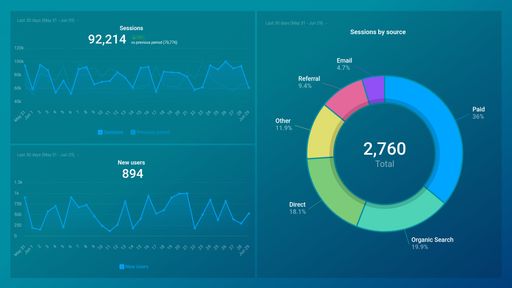
Sessions by Source
Sessions by Source is a metric in Hubspot that shows the number of website sessions generated by different traffic sources, such as organic search, paid search, social media, email marketing, and direct traffic.