Uses one-click integrations:
-
 Google Analytics 4
If you don't use Google Analytics 4, you can pull data from any of our 130+ one-click, native integrations or from spreadsheets, databases and other APIs.
Try this dashboard for free
Google Analytics 4 metrics included in this template
-
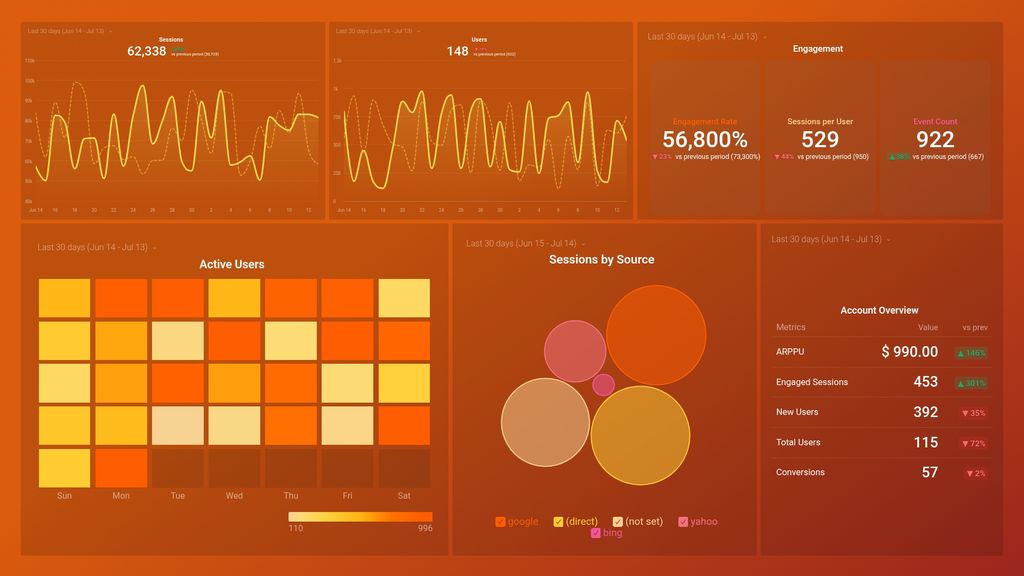
Event Count
The Event Count metric in Google Analytics 4 measures the total number of times a specific event has occurred on your website or app, giving you insight into user engagement and behavior.
-
Sessions per User
The Sessions per User metric in Google Analytics 4 shows the average number of sessions per user during a specific time period. It indicates how frequently users are returning to the website and engaging with its content.
-
ARPPU
The Average Revenue Per Paying User (ARPPU) is a metric that measures the average revenue generated by each paying customer over a specified time period. It helps businesses determine how much value they are deriving from their paying customers and to identify areas that need improvement to increase revenue.
-
Engaged Sessions
Engaged Sessions is a Google Analytics 4 metric that measures the number of sessions where users engaged with the website or app. Engagement is defined as the amount of time spent actively interacting with the content, such as scrolling, clicking, or watching videos.
-
Engagement Rate
Engagement Rate is a metric that measures how users interact with your website or app. It captures the percentage of sessions in which users engaged with your site, such as clicking on a link, watching a video or scrolling through content.
-
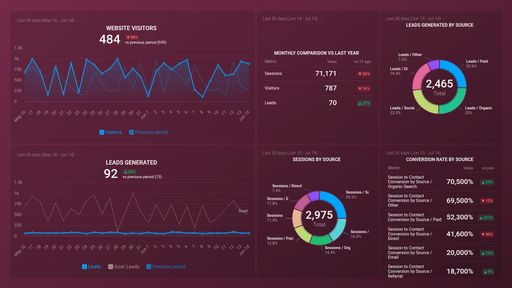
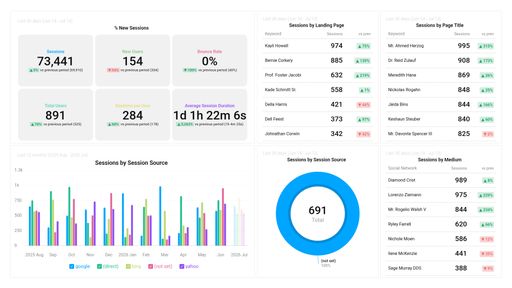
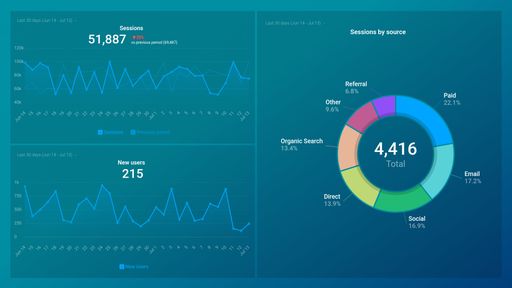
Sessions by Session Source
The Sessions by Session Source metric shows the number of sessions generated by different sources like direct traffic, organic search, referral, email, social media, paid search, etc., and helps in analyzing the effectiveness of various marketing channels in driving traffic to a website.