Lead Generation

Free Lead Generation Dashboard Templates

These lead generation dashboards come pre-built with some of the most commonly tracked lead generation metrics from the most popular tools. You can also customize your templates later. To get started, just choose a template, connect your data, and your metric visualizations will populate automatically.

Create your free Databox account

Track some of the most common Lead Generation metrics and KPIs and analyze your Lead Generation performance with just a few clicks.

TOP Lead Generation INTEGRATIONS
  • Drift
  • Marketo
  • Pinterest Ads
  • Eventbrite
  • LinkedIn Ads
Don’t see your SEO tool?
You can build a dashboard with any data using Zapier, Integromat, Google Sheets, or a SQL database.
Facebook Ads dashboard template provides you with insights about ad engagement, click activity, money spent and more. You can discover which campaigns need improvement.
Facebook Ads
HubSpot Marketing dashboard template provides you with insights to increase traffic, convert leads, and prove ROI.
HubSpot Marketing
The Facebook Ads & Google AdWords template allows you to monitor both your Facebook and Google campaigns at the same time to track your progress and areas to improve upon.
Facebook Ads Google Ads
This Dashboard gives a clear overview of your Reach, Campaign Performance and Community Activity based on Facebook Pages and Facebook Ads metrics.
Facebook Ads Facebook Pages
Download this free Google Analytics 4 Acquisitions dashboard template to dig deeper into your traffic sources, monitor user behavior, and keep an eye on how it all impacts your revenue.
Google Analytics 4
The YouTube Channel Performance dashboard makes it easy to measure video engagement with multiple metrics.
YouTube
A visual snapshot of monthly performance by the sales team.
HubSpot CRM
This dashboard allows you to view Adwords performance and custom insights on the campaign level.
Google Ads
The HubSpot Email Campaign Dashboard shows which emails get opened and clicked over the course of a week or month.
HubSpot Marketing
This dashboard highlights the second part of the inbound funnel- Convert. It shows how well you are creating leads from your site.
HubSpot Marketing Google Universal Analytics
This dashboard leverages rolling Adwords traffic trends and KPIs to constantly monitor the competitive search landscape that your account occupies.
Google Ads
HubSpot (Leads by Source) dashboard template gives insights on which sources of traffic drive the most leads or contacts. It explains where to focus marketing effort.
HubSpot Marketing
This dashboard will show the latest data from all your campaign-level metrics in Facebook Ads.
Facebook Ads
The Social Networks dashboard template integrates Facebook, Twitter, Linkedin and Instagram data. It shows daily traffic across the 4 networks and tracks follower counts..
Facebook Pages Instagram Business LinkedIn Company Pages X (Twitter)
Marketing & Sales dashboard template uses the Hubspot Marketing and Hubspot CRM products to give you a full view of both the top and bottom of your funnel.
HubSpot Marketing HubSpot CRM
This dashboard shows a high-level overview of your Linkedin Ads Campaign performance so you can track ROI.
LinkedIn Ads
The Monthly Marketing dashboard template examines Google Analytics and HubSpot Marketing for a complete view of traffic and user acquisition.
HubSpot Marketing Google Universal Analytics
Focus in on the metrics that matter from your Google Analytics 4 account. Measure the key outcomes that your website was designed to create, as well as the leading indicators that help pinpoint where your greatest opportunities lie.
Google Analytics 4
You can quickly gain insight into how your marketing and sales team is working together. See exactly where your leads are getting held up in the process, and develop a plan of attack to get them unstuck from your funnel.
HubSpot Marketing HubSpot CRM
This template provides information to marketing and sales teams about their conversion rates, as well as giving a clear view of the full funnel and a detailed analysis of how the day-to-day is behaving based on when contacts entered different stages.
HubSpot Marketing
This report combines search, user data plus goals from Google Analytics on your business website and also phone calls / actions from Google My Business.
Google My Business Google Universal Analytics
This dashboard gives you the ability to focus on your Sales KPI's. The simple layout allows you to overview your deal performance in one place.
Pipedrive CRM
This template will enable you gain valuable insights about the growth of your group’s members.
The Hubspot Blogging dashboard template looks at your most highly-trafficked blog posts each month. It measures whether you are hitting monthly goals.
HubSpot Marketing
This dashboard reviews your inbound and PPC tactics for filling your marketing funnel.
HubSpot Marketing Google Ads
This dashboard is designed to help you monitor both your conversion rates and your progress to your traffic and lead goals.
HubSpot Marketing HubSpot CRM
The Facebook Ads, Google Ads & Google Analytics 4 template allows you to monitor your Facebook and Google campaigns at the same time to track your progress and areas to improve upon.
Google Analytics 4 Facebook Ads Google Ads
This dashboard allows you to track all the common KPIs of events from Eventbrite.
Eventbrite
This template was made for C-Level executives who want to track their Marketing and Sales teams KPI's.
HubSpot Marketing HubSpot CRM
This dashboard helps you monitor the performance—organic search traffic, Google Search rankings, CTRs, and conversions—of old blog posts you've recently updated
Google Search Console Google Universal Analytics
This template gives you the ability to aggregate information from 3 HubSpot accounts. Using data calculations, we add together the core marketing funnel values.
HubSpot Marketing HubSpot CRM
This dashboard provides a high-level overview of the impact of your lead generation efforts.
HubSpot Marketing
Adobe Analytics dashboard template uses visits, conversion rates and customer loyalty to help you understand your customers as people — what they want, need, and believe.
Adobe Analytics
Use this free dashboard template to view ratios between current traffic, leads, marketing qualified leads, deals, and customers.
HubSpot Marketing HubSpot CRM
The Organic Traffic Analysis dashboard shows the results of your SEO work alongside key activities on-site from Google Analytics.
SEMrush Google Universal Analytics
This dashboard allows you to compare cost per click and contacts gained to previous periods.
HubSpot Marketing Google Ads
This Marketing & Sales dashboard offers a high level overview of cumulative results driven by digital activity on an annual basis.
HubSpot Marketing HubSpot CRM
The HubSpot Marketing + Sales dashboard template uses data from both Hubspot services to show your full marketing funnel and sales pipeline.
HubSpot Marketing HubSpot CRM
This dashboard gives you an overview of your monthly forecast from Copper so you anticipate your new revenue.
Copper
This dashboard looks at your most highly-trafficked blog posts each month.
HubSpot Marketing
This dashboard gives the user a month-to-date view of their content marketing performance using data from HubSpot Marketing and Google Analytics.
HubSpot Marketing Google Universal Analytics
This dashboard gives an overview of all the activities you have completed in Marketo, with a focus on email.
Marketo
This dashboard allows you to easily view metrics around how you're attracting, converting and closing business, in order to determine how to further pinpoint opportunities for improvement.
HubSpot Marketing Google Universal Analytics
This dashboard lets you analyze your newly acquired customers by tracking the number of new deals created in HubSpot CRM.
HubSpot Marketing HubSpot CRM
This HubSpot Marketing template allows you to compare last year's KPIs to this year's KPIs to your own personal goals. Simultaneously, it gives you the opportunity to share notes on key takeaways.
HubSpot Marketing HubSpot CRM
This dashboard gives an overview of the annual metrics from your HubSpot account, including sales, email, traffic and contacts.
HubSpot Marketing HubSpot CRM
Drift dashboard template which gives you insights about new and closed conversations, reply times by team members and more.
Drift
This template gives you the ability to aggregate information from 2 HubSpot accounts. Using data calculations, we add together the core marketing funnel values.
HubSpot Marketing HubSpot CRM
The Monthly Marketing dashboard template examines Google Analytics 4 and HubSpot Marketing for a complete view of traffic and user acquisition.
Google Analytics 4 HubSpot Marketing
This dashboard gives an overview of user acquisition and behavior on your website based on Google Analytics data.
HubSpot Marketing Google Universal Analytics
This template is perfect for clients who want a general overview of their social media performance without getting into too much detail. This will summarize how their brand is doing within the social community.
Facebook Pages LinkedIn Company Pages X (Twitter) Wistia
Use this free dashboard template to track how awareness video is leading to branded and high-intent searches, track your Facebook ads and Google Ads performance and return on your ad spend.
Facebook Ads Facebook Pages Google Ads Google Universal Analytics
This dashboard shows a high-level report of impact of your traffic generation efforts. See the total vs. new visitors to your site, as well as their corresponding source attribution.
HubSpot Marketing Google Universal Analytics
This dashboard tracks the traffic levels of visitors using chat for assistance, along with the overall performance of Drift Campaigns.
Drift
This dashboard gives you the ability to focus on your Marketing and Sales KPIs as individual components. The simple layout allows you to guide the conversation without any distractions.
HubSpot Marketing HubSpot CRM
This dashboard highlights the second part of the inbound funnel- Convert. It shows how well you are creating leads from your site.
Google Analytics 4 HubSpot Marketing
This dashboard gives you the ability to analyze how email events are performing in order to progress users through the lifecycle stages.
HubSpot Marketing
Focus in on the metrics that matter from your Google Analytics account. Measure the key outcomes that your website was designed to create, as well as the leading indicators that help pinpoint where your greatest opportunities lie.
Google Universal Analytics
The Email Traffic Overview dashboard shows the actions that visitors take on your site after they click into your site from an email.
Google Universal Analytics
Refine PPC and Social Media strategies with Databox's Pinterest Ads integration. Gain insights into Spend, Engagements, ROAS, and more for optimized Lead Generation, Sales Performance, and Ecommerce campaigns.
Pinterest Ads

Build custom Lead Generation dashboards

No design or coding skills necessary.

Learn more about Dashboard Designer

What is a Lead Generation Dashboard?

A lead generation dashboard displays all of the key parts of a lead generation campaign in one place and provides quick insights into how well your lead generation strategies are working.

With the help of a lead generation metrics dashboard, marketing teams are able to discover their highest converting pages, most-clicked keywords, and more, and ultimately prove content marketing ROI.

What Should Be Included in a Lead Generation Dashboard?

A comprehensive lead generation dashboard should include any metrics you need to monitor in order to optimize your content marketing efforts, such as top pages, sessions by source, overall conversion rate, and more.

A carefully crafted lead generation metrics dashboard should help inform your lead generation strategy by answering which specific sources drive the most visits to your website and the highest quality leads for your business.
How to Create a Lead Generation Dashboard

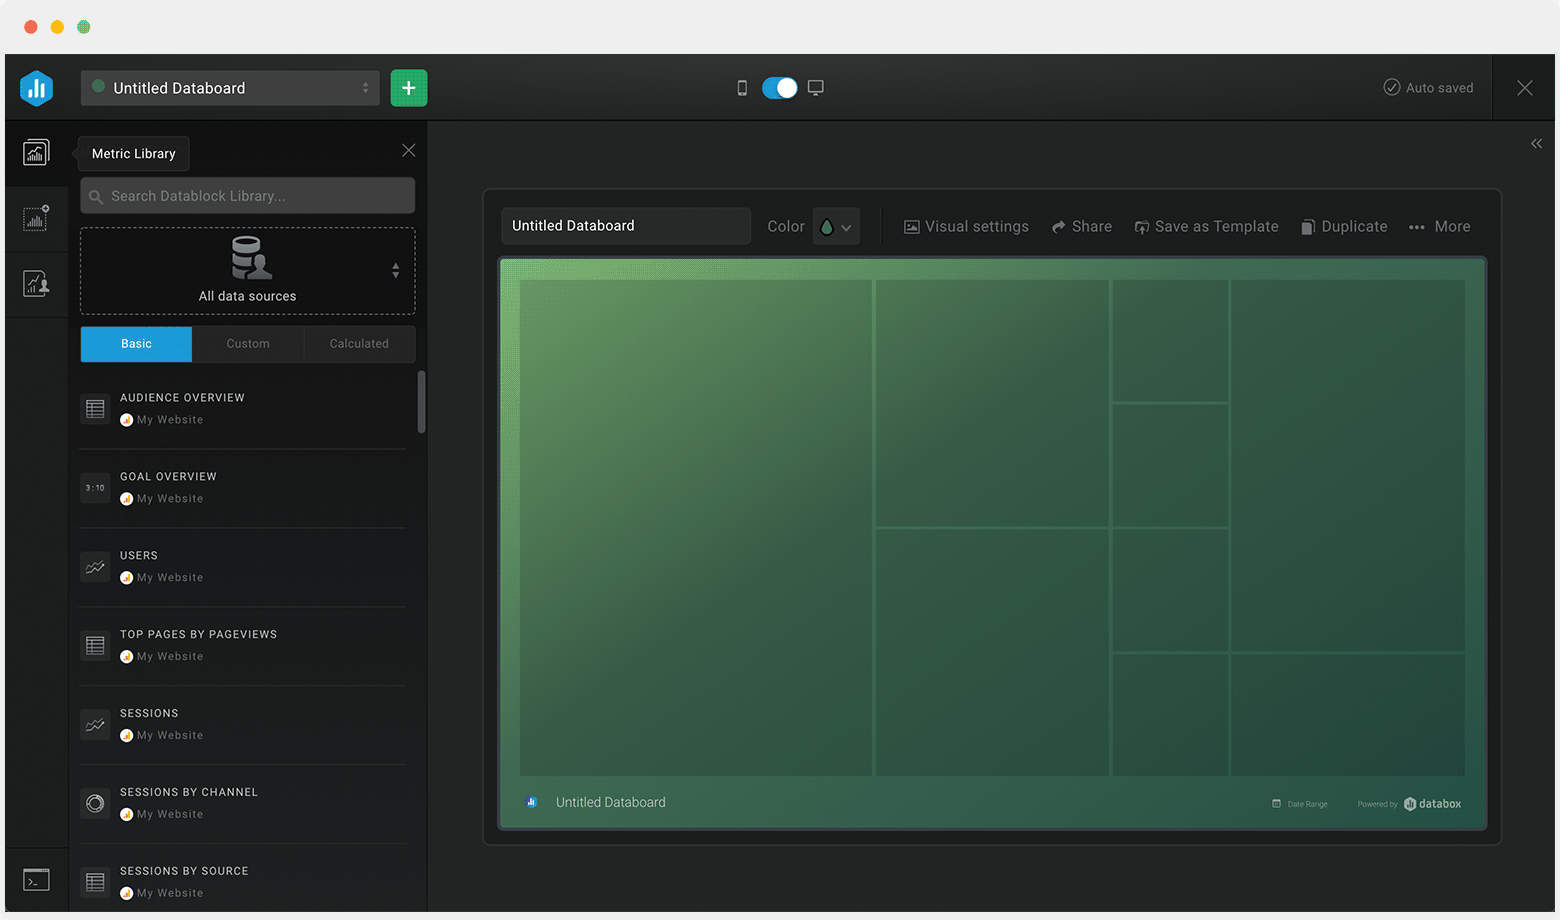
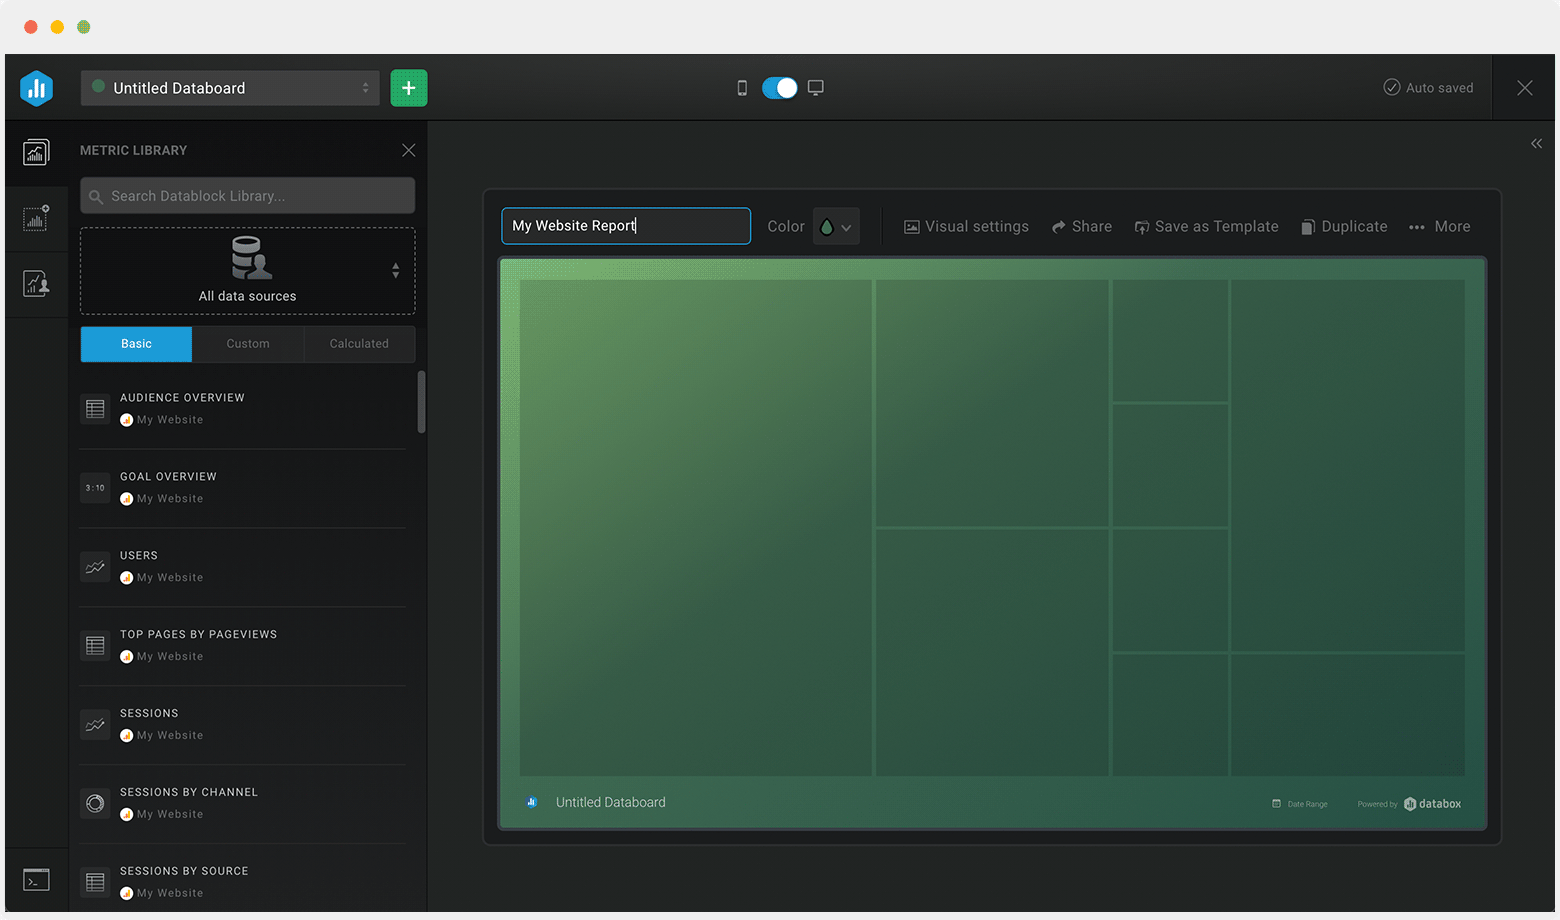
Using Databox’s Dashboard Designer, building a dashboard is as simple as connecting a data source, choosing the metrics you need from our Metrics Library, and watching your visualizations populate in seconds. No coding and design skills are required.

Create a new dashboard using our Designer tool
Name your dashboard
Name your dashboard
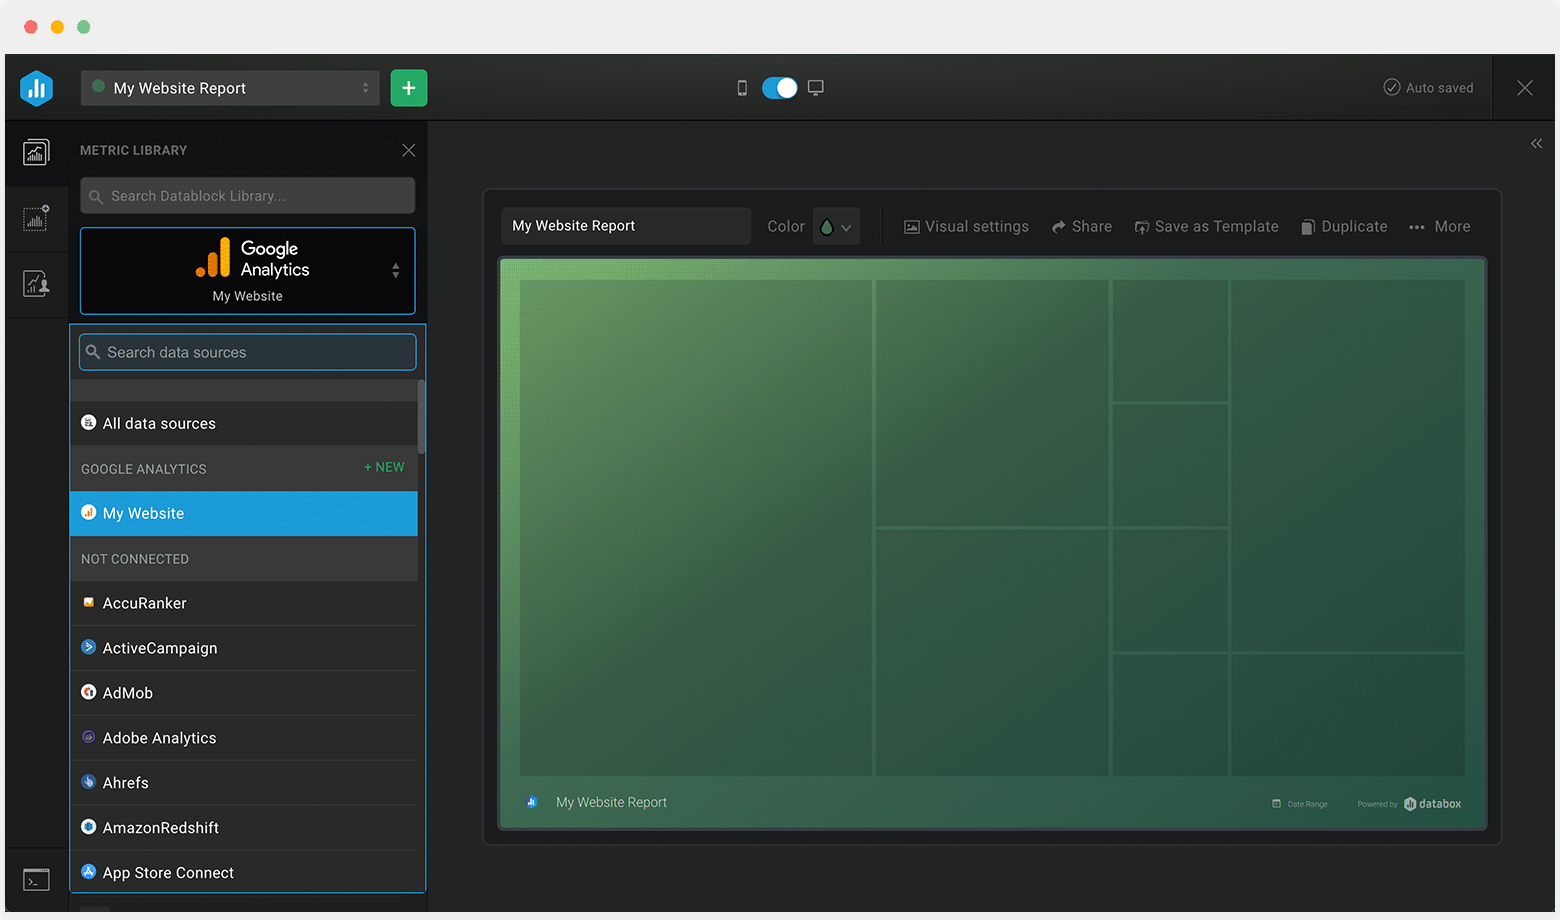
Select a data source
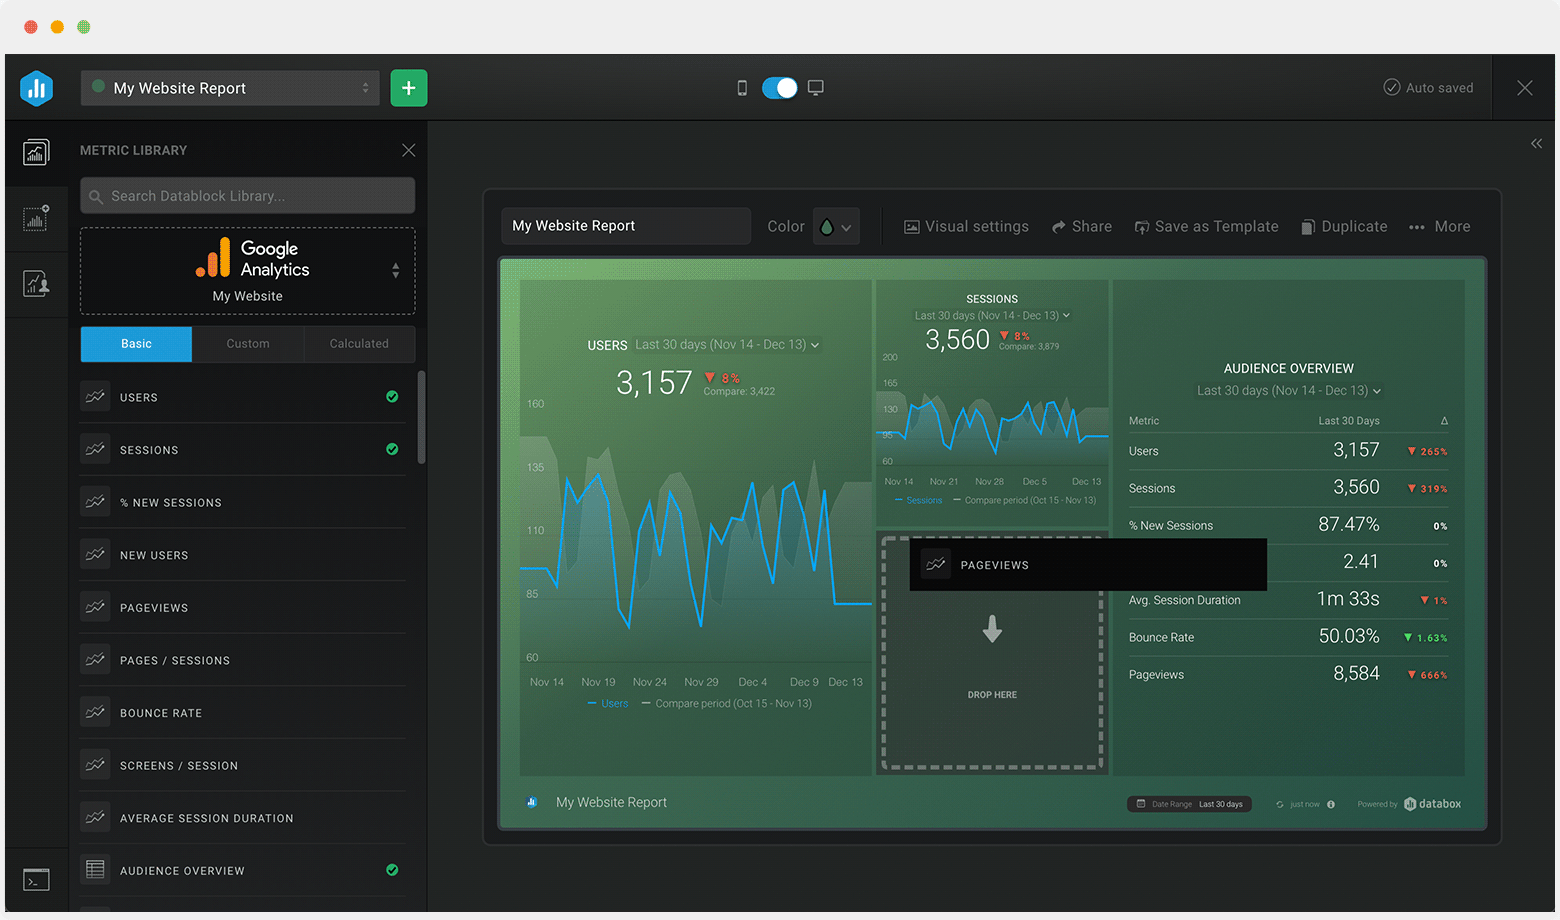
Drag-and-drop pre-built metrics from that source to your dashboard or drag a blank visualization first and select the metric you’d like to associate with it.
Drag-and-drop pre-built metrics from that source to your dashboard
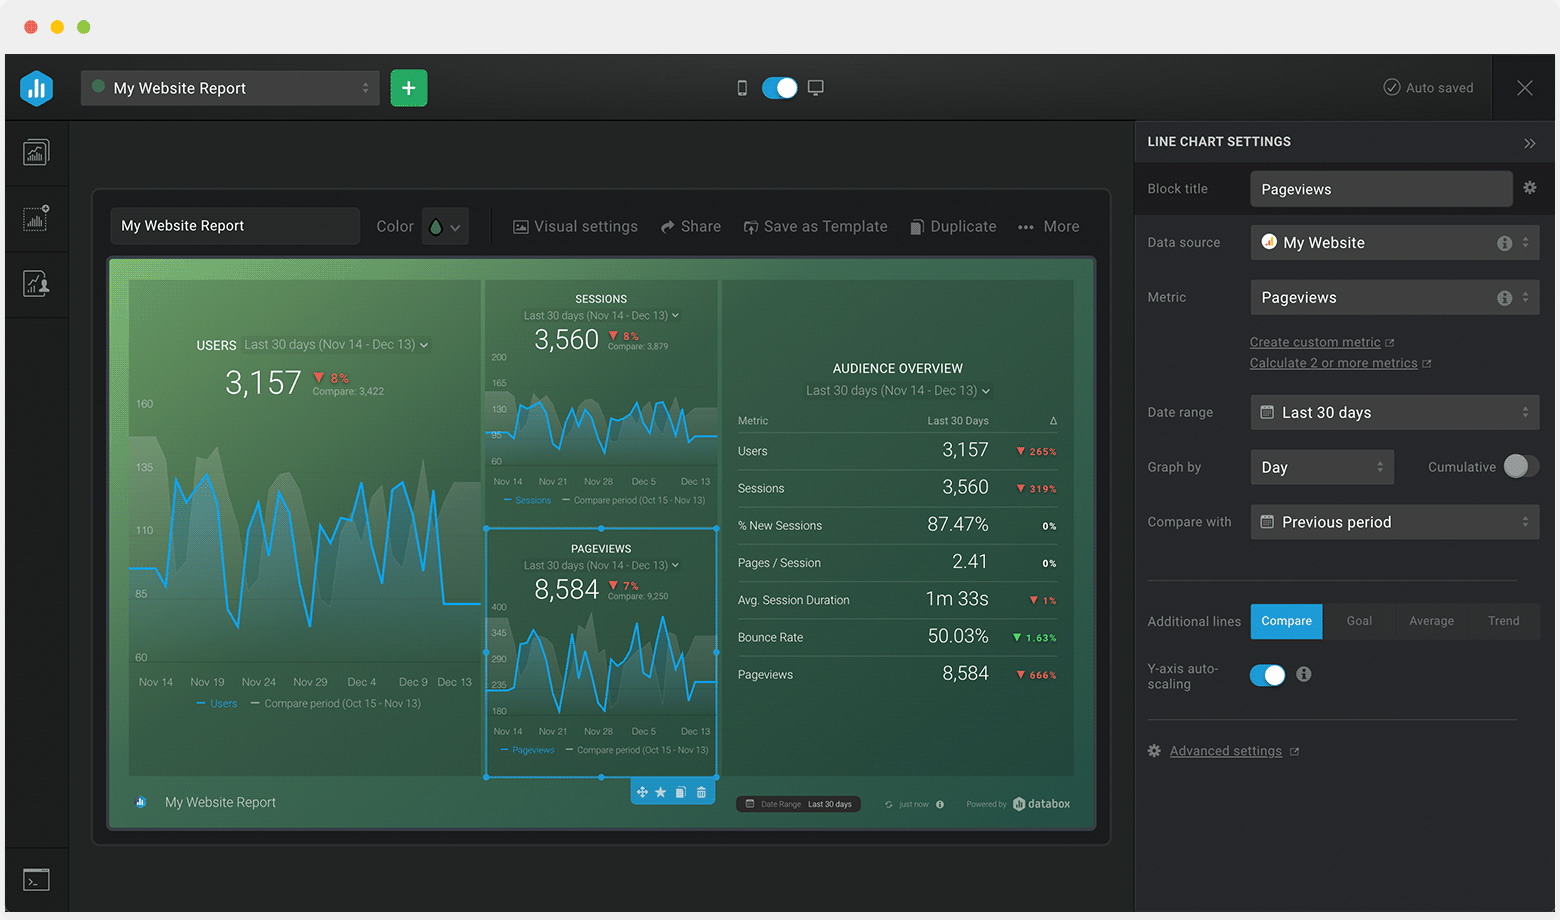
Customize each metric block by date range, comparisons, goals, and more.
Customize each metric block