Uses one-click integrations:
-
 Facebook Ads
-
 Google Ads
If you don't use Facebook Ads or Google Ads, you can pull data from any of our 130+ one-click, native integrations or from spreadsheets, databases and other APIs.
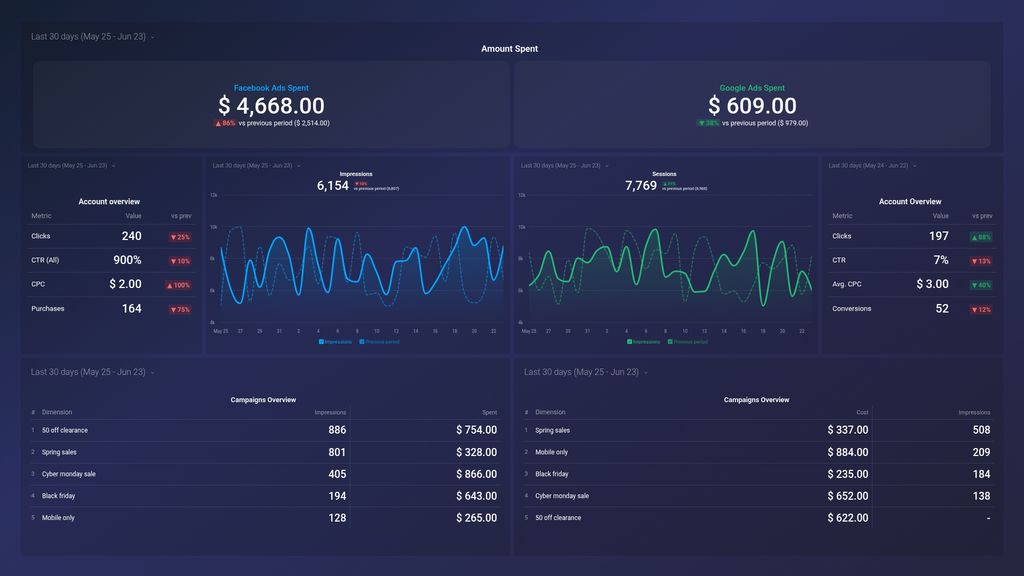
Try this dashboard for freeWhat you’ll learn from this Paid Marketing Overview Dashboard Template:
By connecting your Facebook Ads and Google Ads accounts, you’ll learn:
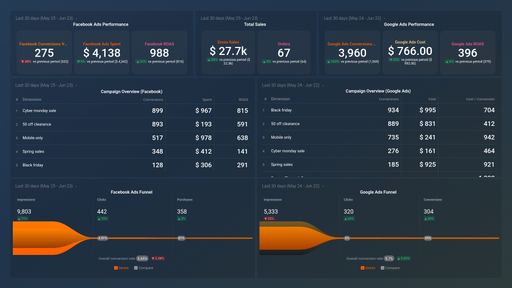
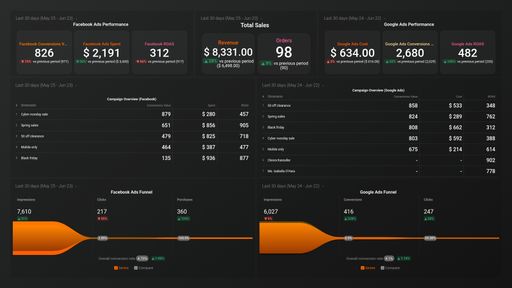
- How much have we spent on Facebook Ads & Google Ads? Monitor your total ad spend across both paid channels and measure your ROI to determine which channel is worth continued investment and which may need some adjustments.
- Do Facebook Ads or Google Ads generate a better ROI? Track engagement metrics like impressions, click-through rate, cost per click, and more, to determine which paid channel is generating a higher ROI.
- Which ad campaigns are working? Keep track of the ad campaigns you’re currently running on Facebook and monitor current spend and impressions to determine which campaigns should be paused and which should receive continued investment.
- Which keywords are driving engagement in Google Ads? See which keywords are generating the most impressions and clicks to your Google Ads campaign. Use this information to adjust ad copy and/or targeting to improve the performance of every campaign.
- What is the cost per conversion from Google Ads? When people click on your ad do they take the desired actions you’d like them to? Measure how much it costs you for every visitor that converts from your ad campaigns. This is important to know to better allocate your ad spend.
Pull additional data using our integration with Facebook Ads
What other campaign metrics can you track and visualize with our integration with Facebook Ads? Almost anything:
- Individual campaign and ad performance
- Clicks, downloads, leads, and sales
- Cost per impression (CPM), click (CPC), and lead (CPL)
- Return on ad spend (ROAS)
- Ad spend and overall budget
- Progress towards your campaign goals, and more
In Databox there are almost 100 Facebook Ads metrics already built and ready for you to visualize in a variety of different ways. With the use of Query Builder and Data Calculations, the range of different metrics and metric combinations you can track from Facebook Ads widens.
Read more about Databox’s Facebook Ads integration.
Pull additional data using our integration with Google Ads
What else can you track and visualize with our deep integration with Google Ads? When it comes to analyzing your campaigns, pretty much anything:
- Impressions, clicks, and conversions
- Cost analysis
- Keyword analysis
- Conversion analysis
- Engagement by Ad, Ad Group, and Ad Campaign, and more.
There are numerous metrics and metric combinations you can track using Google Ads. And in Databox, you can quickly visualize dozens of Google Ads metrics in a variety of ways.
Read more about Google Ads integration.
Pull additional data using our deep integration with Google Universal Analytics.
What else can you track and visualize with our deep integration with Google Universal Analytics? When it comes to attributing your to traffic and conversions, almost anything:
- Website traffic and conversions
- Traffic and lead demographics
- SEO results
- Social media engagement
- Paid advertising
- Landing page performance
- Campaign performance using custom events
There are many, many different metrics and metric combinations you can track using Google Universal Analytics. And in Databox, you can quickly visualize 100s of Google Universal Analytics metrics in a variety of different ways.
Read more about Databox’s Google Universal Analytics integration.
Google Ads metrics included in this template
-
Conversions
The Conversions metric measures the number of desired actions taken by users on your website after clicking on your ad, such as completing a purchase or filling out a form.
-
CTR
Click-Through Rate (CTR) is the ratio of clicks to impressions of an ad, expressed as a percentage. It measures the effectiveness of an ad and indicates how relevant it is to the target audience.