


Table of contents
This data was sourced from just over 25,000 Datablocks used to track Facebook metrics in Databox. (What is a Datablock?)
According to a study by EdgeRanker Checker, the average post on a Facebook Page has a clickthrough rate of 0.15%.
Put another way, a link that you post to your Facebook Page will need an average of 715 impressions to get one click.
Or, 99.85% of viewers will not click your post (on average).
Now, link clicks shouldn’t be the number one goal of your Facebook strategy, as depending on your budget and overall reach, you’d need a massive number of impressions to create any sort of click volume.
(Also, like both Amazon and Google, Facebook continues to evolve its product strategy in an effort to keep more users on the platform rather than click off to third-party websites.)
Consider that Facebook users can indicate their interest–and engage–through a like, reaction, share, or comment. Facebook’s analytics and reporting tools have evolved significantly, with a recent focus on simplifying metrics by prioritizing ‘views’ as the primary performance metric across all content types. This aligns Facebook’s data reporting more closely with Instagram’s, providing a unified approach for marketers.

To understand which of these metrics are most popular for measuring the success of a Facebook marketing strategy, we looked at the most-tracked Facebook metrics from Databox users.
In total, that meant analyzing more than 25,000 Facebook metrics being tracked in Databox.
Here are the most-tracked Facebook metrics, with examples for how to track each one with a social media dashboard software.
First, What’s a Datablock?
A Datablock is one block of data that, along with any number of other Datablocks, make up a single dashboard.
They’re customizable, resizable, and many of them are pre-configured so that all users need to do is drag and drop them to their dashboard to quickly visualize data.
All dashboards are made up of Datablocks. Here’s a quick video for how they work…
Top 10 Most-Tracked Facebook Metrics
- Page Engagements (likes, shares, reactions, and comments)
- Page Followers (previously ‘Page Likes’)
- Cost per Thousand Impressions (CPM)
- Amount Spent on Ads
- Ad Frequency
- Click-Through Rate (CTR)
- Page shares
- Video Views (prioritized over static posts by the algorithm)
- Page comments
- Cost per Click (CPC) for ads
PRO TIP: What’s the overall engagement of your ad campaigns?
Want to make sure your Meta ads are performing and trending in the right direction across platforms? There are several types of metrics you should track, from costs to campaign engagement to ad-level engagement, and so on.
Here are a few we’d recommend focusing on.
- Cost per click (CPC): How much are you paying for each click from your ad campaign? CPC is one of the most commonly tracked metrics, and for good reason, as if this is high, it’s more likely your overall return on investment will be lower.
- Cost per thousand impressions (CPM): If your ad impressions are low, it’s a good bet everything else (CPC, overall costs, etc.) will be higher. Also, if your impressions are low, your targeting could be too narrow. Either way, it’s important to track and make adjustments when needed.
- Ad frequency: How often are people seeing your ads in their news feed? Again, this could signal larger issues with targeting, competition, ad quality, and more. So keep a close eye on it.
- Impressions: A high number of impressions indicates that your ad is well optimized for the platform and your audience.
- Amount spent: Tracking the estimated amount of money you’ve spent on your campaigns, ad set or individual ad will show you if you staying within your budget and which campaigns are the most cost-effective.
Tracking these metrics in Facebook Ads Manager can be overwhelming since the tool is not easy to navigate and the visualizations are quite limiting. It’s also a bit time-consuming to combine all the metrics you need in one view.
We’ve made this easier by building a plug-and-play Facebook Ads dashboard that takes your data and automatically visualizes the right metrics to give you an in-depth analysis of your ad performance.
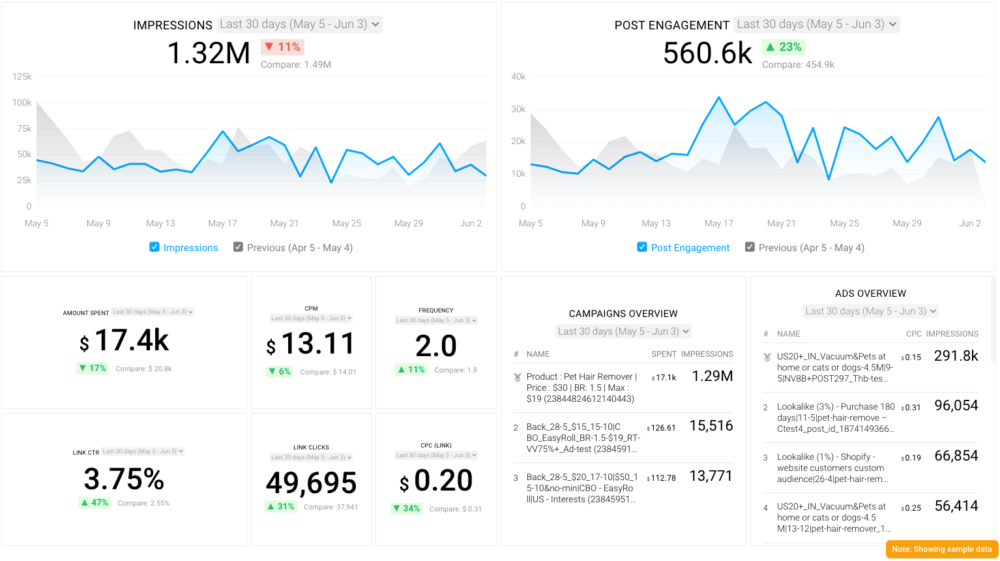
With this Facebook Ads dashboard, you can quickly discover your most popular ads and see which campaigns have the highest ROI, including details such as:
- What are your highest performance Facebook Ad campaigns? (impressions by campaign)
- How many clicks do your ads receive? (click-through rate)
- Are your ad campaigns under or over budget? (cost per thousand impressions)
- What are your most cost-efficient ad campaigns? (amount spent by campaign)
- How often are people seeing your ads in their news feed? (ad frequency)
And more…
You can easily set it up in just a few clicks – no coding required.
To set up the dashboard, follow these 3 simple steps:
Step 1: Get the template
Step 2: Connect your Facebook Ads account with Databox.
Step 3: Watch your dashboard populate in seconds.
Top 10 Facebook Metrics Defined
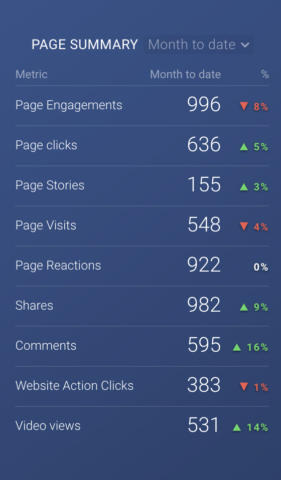
Page Engagements (Views)
As of late 2024, ‘Views’ has emerged as Facebook’s primary performance metric, streamlining the evaluation of content by combining data from video plays, photo impressions, and text post engagements. This unified approach makes it easier for marketers to assess the overall visibility and resonance of their content across Facebook and Instagram. By emphasizing ‘Views,’ Facebook ensures that marketers focus on a metric that reflects both reach and user interest, regardless of the content format.
This shift encourages brands to prioritize creating engaging, high-quality content that captures attention in a crowded feed. Pairing ‘Views’ with complementary metrics like engagement rate and click-through rate provides a comprehensive understanding of campaign success and audience interaction.
Pro Tip: Use ‘Views’ as a foundational metric to gauge initial content performance, then dive deeper into specific engagement actions (likes, comments, shares) for a more nuanced analysis.
Recommended Datablock: Use a line chart to track ‘Views’ over time, incorporating comparisons by content type or campaign for actionable insights.
Up to date referencing for facebook metrics
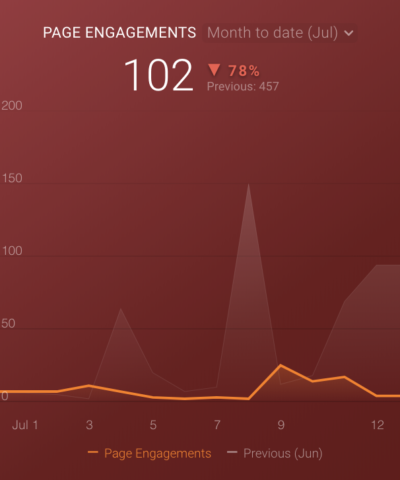
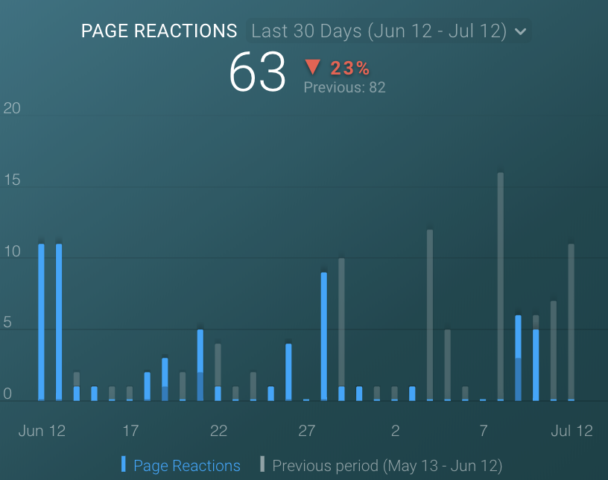
The ‘Page Engagements’ metric measures unique interactions with your brand’s organic Facebook content, such as likes, reactions, shares, comments, and clicks. It’s a key indicator of audience interaction but should now be analyzed alongside ‘Views’ for a comprehensive performance evaluation. This is still an important measure of how well your content resonates with your audience, although the new emphasis on views requires integrating both metrics for a complete analysis.
Views As of late 2024, ‘Views’ has become Facebook’s primary performance metric, encompassing video plays, photo impressions, and text post engagements. This simplified metric allows for a more holistic evaluation of content performance across Facebook and Instagram. Recommended Datablock: Use a line chart to track views over time with comparison options.
Also important- this is the total number of people that interact, not the total number of interactions.
This gives you an overall view of whether your posts are cutting through the noise of the News Feed. It’s a good holistic measurement of whether you are reaching the 99.85% of people that will not click the link.Recommended Datablock: Use the line chart with comparisons turned on.
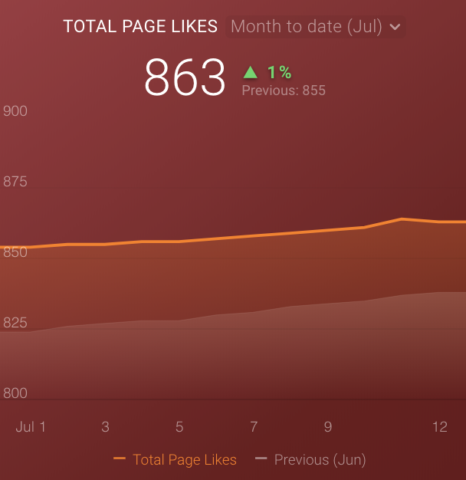
Page Followers
The ‘Page Followers’ metric tracks the total number of users who choose to follow your page over a specific period, reflecting sustained interest in your brand and its updates. Unlike ‘Likes,’ which represent a one-time interaction, ‘Followers’ signify an active decision to stay engaged with your content over time. This metric is crucial for assessing your audience’s growth and the potential for organic reach.
An increase in followers indicates effective content strategies and audience targeting, while a decline may signal the need for a content refresh or better engagement practices. This metric also serves as a strong foundation for paid strategies, allowing you to retarget your followers or create lookalike audiences to expand your reach further.
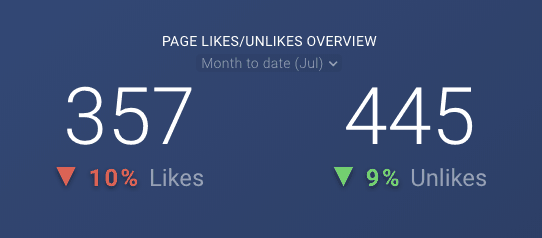
Pro Tip: Monitor follower trends alongside engagement metrics like ‘Views’ and ‘Reactions’ to understand how well your content resonates with your growing audience.Recommended Datablock: Use a ‘Compare’ Datablock to track new followers versus unfollows over time, helping you identify patterns and refine strategies for audience retention and growth.
Cost per Thousand Impressions (CPM)
The ‘Cost per Thousand Impressions (CPM)’ metric calculates the cost of delivering 1,000 ad impressions, serving as a key indicator of your campaign’s cost-efficiency and budget optimization. By understanding your CPM, you can evaluate whether your ads are effectively reaching your target audience within the constraints of your advertising budget.
A low CPM typically suggests well-targeted, high-quality ads that resonate with your audience, while a high CPM could indicate issues with audience targeting, competitive bidding, or ad relevance. This metric is particularly valuable when compared across campaigns to identify which strategies deliver the most impressions for the least cost.
Pro Tip: Combine CPM insights with engagement metrics like click-through rate (CTR) to evaluate not just the reach of your ads, but how effectively they drive user actions. Adjusting targeting parameters, ad placements, or creative assets can help optimize CPM over time.
Recommended Datablock: Use a Number Datablock to track CPM across campaigns, paired with comparison options to highlight trends and identify the most cost-effective approaches.
Amount Spent on Ads
The ‘Amount Spent on Ads’ metric reflects the total budget expended on your ad campaigns, ad sets, or individual ads over a specific period. This metric is essential for keeping your advertising efforts within budget while assessing the overall cost-efficiency of your campaigns.
By regularly monitoring your ad spend, you can identify which campaigns are delivering the best return on investment (ROI) and make informed decisions about reallocating budgets to high-performing ads. Additionally, tracking this metric alongside performance indicators such as impressions, click-through rate (CTR), and conversions helps provide a clear picture of your campaign’s effectiveness.
Pro Tip: Set budget thresholds and alerts to ensure spending stays aligned with your goals. Pair this metric with metrics like cost per click (CPC) or cost per conversion to pinpoint which campaigns are providing the most value.Recommended Datablock: Use a bar graph to display ad spend by campaign, with comparison options enabled to visualize budget trends and identify areas for optimization.
Ad Frequency
The ‘Ad Frequency’ metric measures the average number of times a single user views your ad within a specific timeframe. While consistent exposure can reinforce your brand message, excessive frequency can lead to ad fatigue, where users begin to ignore or even react negatively to your ads.
Monitoring this metric is essential to strike a balance between visibility and user experience. A low frequency might indicate that your ads are not being seen often enough to leave an impact, whereas a high frequency could suggest that your audience is too narrowly targeted or that your ad creative needs refreshing.
Pro Tip: Aim for an optimal frequency range, typically between 1.5 and 3 exposures per week, depending on your industry and campaign objectives. Combine this metric with engagement metrics like click-through rate (CTR) to evaluate whether repeated exposure is driving the desired actions.
Recommended Datablock: Use a line graph to track frequency trends over time, segmented by ad campaign or audience, to identify patterns and adjust strategies for better results.
Click-Through Rate (CTR)
The ‘Click-Through Rate (CTR)’ metric calculates the percentage of users who clicked on your ad after seeing it, offering a clear indicator of how compelling your ad creative, messaging, and call-to-action (CTA) are. A high CTR demonstrates that your ad resonates with your target audience, driving them to take the desired action, while a low CTR might suggest the need for optimization in your targeting, design, or messaging.
CTR is a critical metric for evaluating the immediate effectiveness of your ads and can be used to diagnose performance issues. For instance, a strong CTR paired with low conversions might point to challenges on your landing page, whereas a weak CTR could signal issues with your ad’s relevance or appeal.
Pro Tip: Benchmark your CTR against industry standards and adjust elements like headlines, visuals, or audience targeting to improve performance. Segmenting CTR by device or demographic can also provide valuable insights for refining your strategy.
Recommended Datablock: Use a line chart to compare CTR across campaigns or track trends over time. Segment data by ad type or audience to uncover deeper insights into what drives clicks.
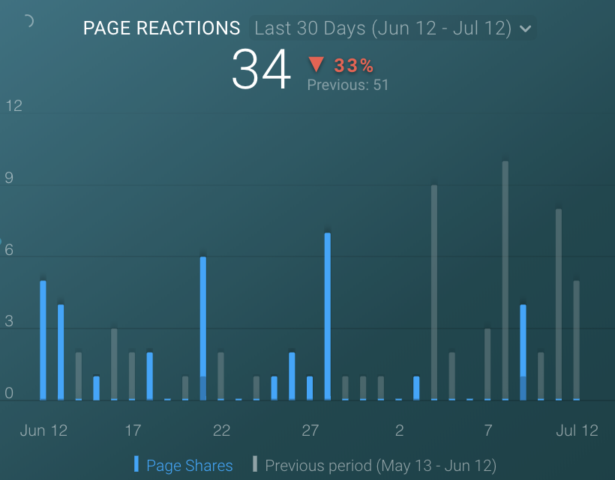
Page Shares
The ‘Page Shares’ metric tracks the total number of times your posts are shared by users within a specified date range. Shares are one of the most valuable forms of engagement on Facebook, as they amplify your content’s reach by exposing it to the sharer’s network. This organic reach can significantly boost brand visibility and credibility, often surpassing the impact of reactions or comments.
However, shares are also among the most challenging metrics to achieve. Facebook users are often selective about sharing content on their personal profiles, making it crucial to create posts that are highly relevant, emotionally engaging, or offer tangible value, such as helpful tips, inspiring stories, or exclusive offers.
Pro Tip: Experiment with shareable content formats such as infographics, videos, or timely news. Running contests or giveaways that incentivize sharing can also help drive this metric while maintaining authenticity.
Recommended Datablock: Use a bar graph to compare shares across posts or campaigns. Enable comparisons to identify trends and uncover which types of content are most likely to be shared.
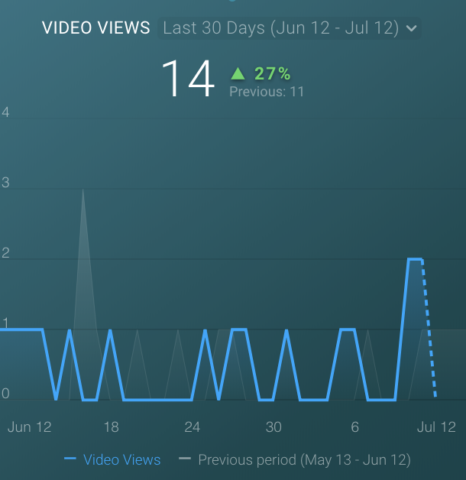
Video Views
The ‘Video Views’ metric measures the number of times users watch your video content for at least three seconds. Video remains one of the most powerful formats on Facebook, with the platform prioritizing video content in its algorithm, especially live videos and engaging short clips. This focus allows video content to achieve higher visibility and better engagement compared to static posts.
Tracking video views is essential for evaluating the initial impact of your content. Beyond three-second views, consider monitoring additional video metrics, such as average watch time and completion rates, to gain deeper insights into viewer behavior and the effectiveness of your messaging.
Pro Tip: To maximize video views, create content that captures attention in the first few seconds, incorporates captions for silent playback, and utilizes square or vertical formats optimized for mobile viewing. Experiment with live videos and stories for even greater reach and engagement.
Recommended Datablock: Use a line graph to track video views over time and compare performance across different videos or campaigns. Combine this with metrics like engagement and watch time for a more comprehensive analysis.
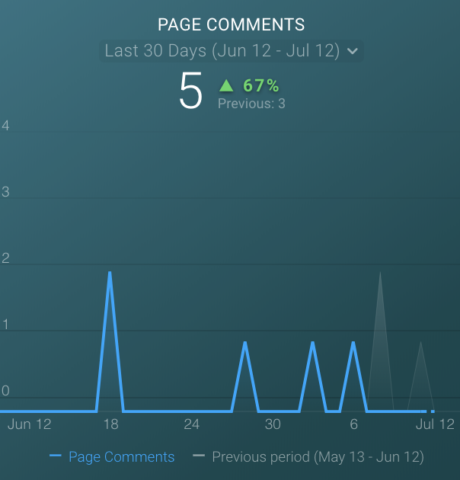
Page Comments
The ‘Page Comments’ metric tracks the total number of comments across all posts within a specified date range. Comments are a valuable form of engagement as they reflect deeper audience interaction and can provide insights into how your audience perceives your content. Unlike reactions or shares, comments often involve more thoughtful responses, making them an excellent indicator of audience sentiment and interest.
Driving comments requires creating content that sparks conversation. Timely, provocative, or emotionally engaging posts are more likely to encourage users to share their thoughts. Asking open-ended questions, soliciting feedback, or posting about trending topics can significantly increase the likelihood of receiving comments.
Pro Tip: Engage directly with commenters to build a sense of community and encourage further interactions. Responding thoughtfully can also boost your content’s visibility in the algorithm, as Facebook values meaningful conversations.
Recommended Datablock: Use a line graph to track comments over time and compare performance across campaigns or content types. Pair this with sentiment analysis to gain a clearer understanding of audience feedback.
Cost per Click (CPC)
The ‘Cost per Click (CPC)’ metric calculates the average cost you pay for each click on your ads. It’s a key measure of your ad efficiency, reflecting how effectively your campaign drives user interaction while staying within budget. A lower CPC generally indicates better ad performance, with well-targeted, compelling ads resonating with your audience.
A high CPC, on the other hand, might signal issues such as poorly targeted audiences, unappealing creative assets, or irrelevant messaging. Regularly monitoring and comparing CPC across campaigns or ad sets can help identify areas for improvement and ensure your advertising dollars are well-spent.
Pro Tip: To reduce CPC, test different audience segments, ad formats, and CTAs. Optimizing for highly relevant audiences and creating visually engaging ads with strong messaging can significantly improve performance. Aligning CPC analysis with conversion metrics like cost per lead (CPL) or cost per acquisition (CPA) offers a fuller picture of campaign ROI.
Recommended Datablock: Use a bar graph to compare CPC across campaigns or ad sets. Enable comparison options to spot trends and identify which strategies yield the best results.
Common Mistakes When Analyzing Facebook Metrics
Even the most experienced marketers can make mistakes when analyzing Facebook metrics. Avoiding these common pitfalls will help you make data-driven decisions and improve your campaign results:
1. Focusing Solely on Vanity Metrics
Metrics like page likes and reactions are useful for measuring initial engagement but don’t always correlate with meaningful outcomes like leads or sales. Overemphasizing these metrics can lead to strategies that prioritize superficial interactions over real business impact.
How to Avoid:
Balance your analysis by tracking performance metrics like CTR, CPC, and conversions alongside engagement metrics. Focus on metrics that directly align with your campaign goals.
2. Ignoring Ad Frequency
A high ad frequency means your audience is repeatedly exposed to the same ad, which can lead to ad fatigue. Overexposure can annoy users, reduce engagement, and negatively impact your brand perception.
How to Avoid:
Monitor ad frequency regularly and refresh your ad creative, messaging, or targeting once frequency exceeds 2–3 views per user. Rotate ads to keep content fresh and relevant.
3. Misinterpreting CTR in Isolation
A high click-through rate (CTR) is a positive sign, but it doesn’t always indicate success. If clicks aren’t converting into leads or sales, the problem may lie with your landing page, offer, or audience targeting.
How to Avoid:
Analyze CTR alongside conversion metrics like cost per lead (CPL) or cost per acquisition (CPA). Ensure your landing page matches the intent of your ad and offers a seamless user experience.
4. Overlooking the Context of Metrics
Looking at metrics in isolation, such as CPC or CPM, without considering the overall campaign context, can lead to misleading conclusions. For instance, a high CPM might be acceptable if your ads are driving high-value conversions.
How to Avoid:
Evaluate metrics holistically. Compare them across campaigns and consider their relationship to your goals. For example, pair CPC with CTR to assess efficiency or CPM with reach to evaluate audience targeting.
5. Neglecting A/B Testing
Assuming that your first ad creative or targeting strategy will perform well can limit your campaign’s potential. Without A/B testing, you miss opportunities to identify what resonates most with your audience.
How to Avoid:
Always test different versions of your ads, including headlines, visuals, CTAs, and targeting options. Use the results to refine your strategy and improve overall performance.
6. Setting Unrealistic Expectations
Expecting immediate or exaggerated results can lead to frustration and hasty decisions. Metrics like page growth and engagement often take time to develop, especially for newer campaigns.
How to Avoid:
Set realistic benchmarks based on industry averages and your historical data. Monitor trends over time and celebrate incremental improvements.
7. Failing to Align Metrics with Campaign Goals
Tracking too many metrics without a clear focus can dilute your analysis. For example, focusing on CPM might not make sense if your goal is lead generation.
How to Avoid:
Define your campaign objectives clearly (e.g., brand awareness, lead generation, or sales) and prioritize metrics that directly support those goals.
How To Measure The ROI of Facebook Marketing
Okay, so post engagements seem to be the most popular KPI, with 5 of the top 10 metrics falling in that category alone, with a ton of advertisers in this Facebook ads research agreeing as well.
That’s great for social media marketers just trying to start conversations. But, if you are thinking that these metrics seem pretty disconnected from generating revenue, I agree with you. How the heck do page engagements translate to sales?
In our guide to measuring social media ROI, many experts weighed in on that question. With Facebook’s shift to views as a central metric, marketers should integrate Facebook’s data with tools like Google Analytics, HubSpot, or Databox to track ROI more effectively. For example, focus on how ad impressions and engagement metrics like cost-per-click (CPC) and click-through rate (CTR) translate into sales, while ensuring your audience targeting aligns with revenue goals. Then, you need to find out if those visitors convert into leads and, finally, if those leads convert into sales using a social media dashboard.”
In short, if you’re serious about using Facebook to grow your revenue, you need to use analytics data from other tools too. I’d recommend starting with our free Google Analytics Social Media dashboard.
Do you have any other metrics that are essential for measuring your success as a social media marketer? Let me know in the comments.


