Uses one-click integrations:
-
 Facebook Ads
-
 Google Ads
-
 Shopify
If you don't use Facebook Ads, Google Ads or Shopify, you can pull data from any of our 130+ one-click, native integrations or from spreadsheets, databases and other APIs.
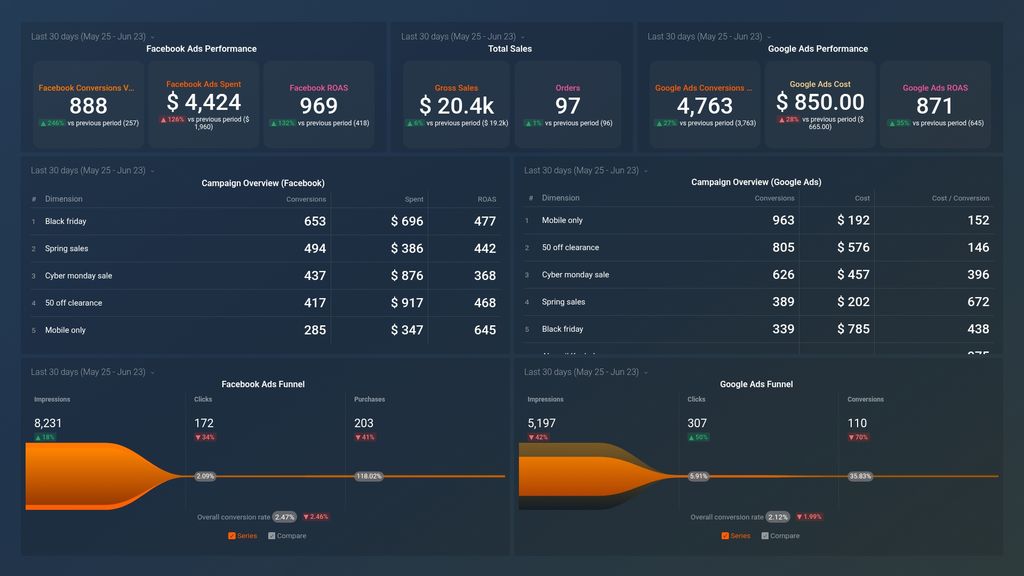
Try this dashboard for freeWhat You Will Learn From This Shopify Ecommerce Dashboard for Google and Facebook Ads
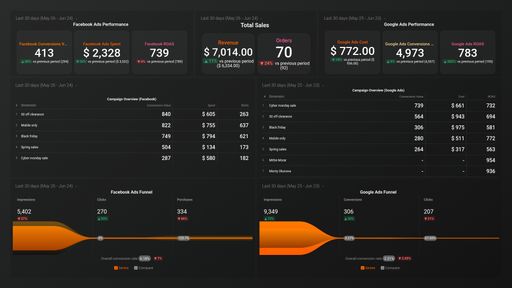
The integration of Google Ads, Facebook Ads, and Shopify analytics into your Shopify dashboard allows you to track advertising performance as well as store growth. This dashboard delivers actionable insights that help you optimize campaigns, improve ROI, and scale your ecommerce business.
How well are your ads performing on Google and Facebook?
With our ecommerce dashboard, you can measure and analyze key metrics such as impressions, clicks, conversions, CPA, and ROAS. Now you can evaluate how Google and Facebook Ads are working to help your Shopify store grow successfully and devise appropriate marketing plans.
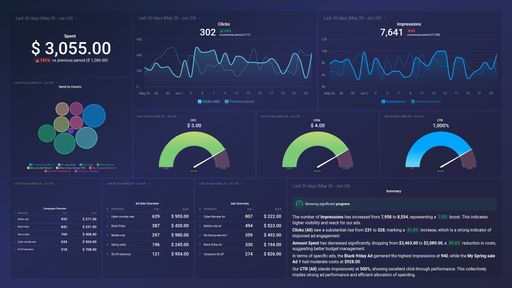
Where is your traffic coming from?
You can now measure which channel is driving the most traffic to your store using our Google Analytics for Shopify integration, including organic search, paid ads, social media, or referrals. Knowledge of traffic sources empowers you to make better budget allocation decisions and shift focus to higher-converting channels.
Are your ads generating sales that are worth the cost?
With the ecommerce analytics dashboard, you can analyze ad-driven revenue, conversion rates, and customer lifetime value (CLV). Measure profitability by comparing ad spend to revenue, allowing you to adjust campaigns for better performance.
How involved are your website visitors?
Examine bounce rates, session times, and pages per visit using shopping engagement metrics from your analytics. Knowing how users interact with your store will help you enhance landing pages and optimize checkout flows to decrease cart abandonment rates.
Which other metrics can you measure and display?
With Databox’s Shopify Ecommerce Dashboard, you are able to track:
Ad performance on Google Ads and Facebook Ads
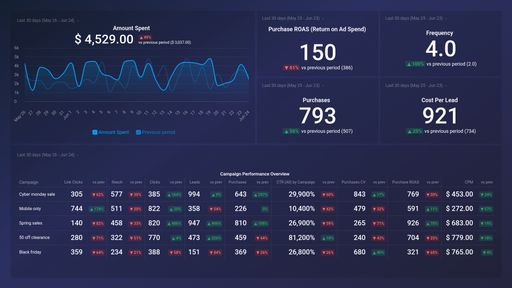
Customer acquisition cost (CAC) and ROAS
Sales and revenue
Sources of traffic and user activities
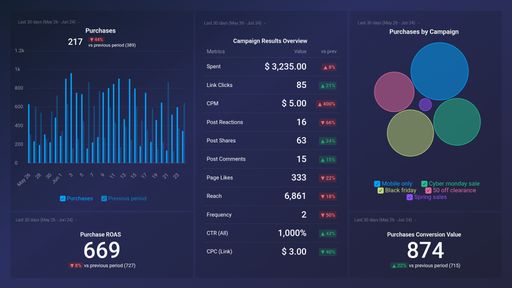
Best-performing products and top sellers
Abandonment rates for shopping carts
Shopify analytics data
Now, you can monitor real-time data with your Shopify analytics, giving you a clear overview to ensure smarter marketing strategies, ad strategy optimization, and sustainable growth for your ecommerce business.
This keeps the original text unchanged, just formatted for better readability and easy copy-pasting. Let me know if you need any further adjustments! 🚀
Google Ads metrics included in this template
- Google Ads ROAS by Campaign