Uses one-click integrations:
-
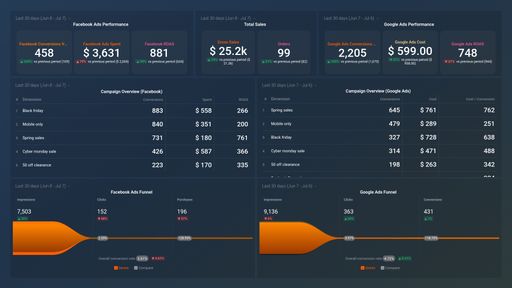
 Facebook Ads
-
 Google Ads
-
 BigCommerce
If you don't use Facebook Ads, Google Ads or BigCommerce, you can pull data from any of our 130+ one-click, native integrations or from spreadsheets, databases and other APIs.
Try this dashboard for free
BigCommerce metrics included in this template
-
Orders
The Orders metric tracks the number of completed purchases made by customers on a BigCommerce store.
-
Revenue
Revenue is a measure of the total amount of money generated from sales of products or services over a specific period of time, indicating the financial success of a business.