


Already have an account? Sign in
Sign up for free
Connect your datasources and instantly see your data in this template.
Creating your account...
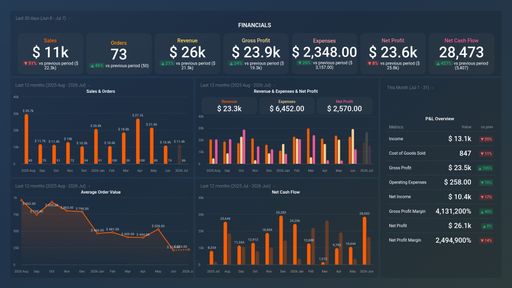
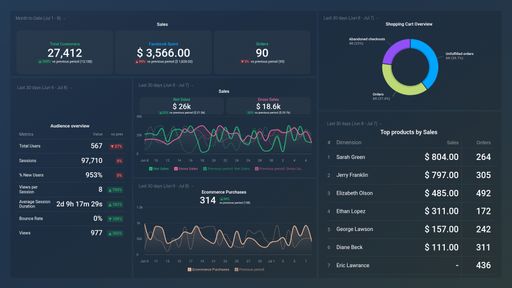
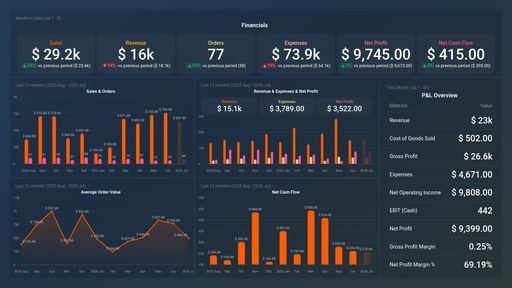
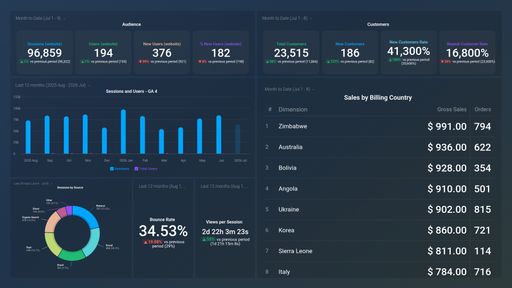
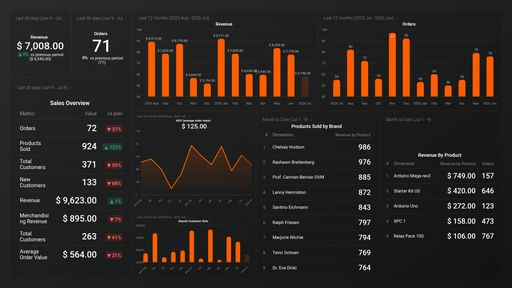
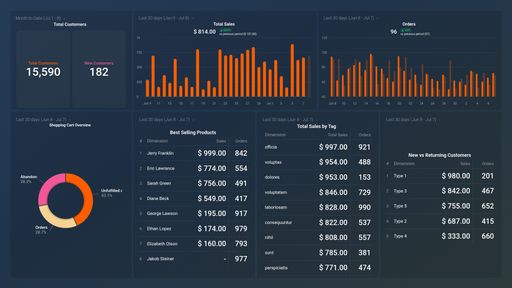
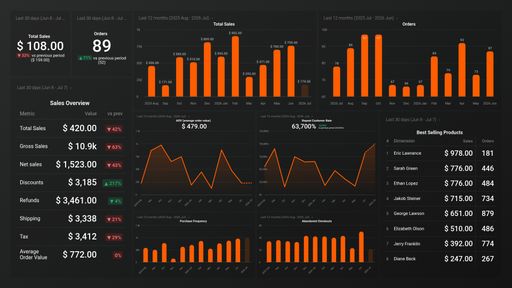
The Shopify dashboard acts as your virtual command center, offering comprehensive insights into your marketing and sales, allowing you to monitor orders and revenue effectively. It features charts and tables designed to provide a detailed breakdown of orders and customers, ensuring you have all the necessary information at your fingertips. This dashboard is crucial for analyzing metrics that influence your business growth, enabling you to make informed decisions backed by data rather than intuition. It offers a wealth of information, including insights into cart abandonment triggers, revenue generated over specific periods, and the demographics of both new and returning customers. By learning how to craft an intuitively easy-to-use dashboard, you can keep a close eye on all the essential Shopify metrics crucial for your business’s success.
Your Shopify dashboards should offer insights into cart abandonment triggers, revenue generated over specific periods, and the demographics of both new and returning customers. By learning how to craft an intuitively easy-to-use dashboard, you can keep a close eye on all the essential Shopify metrics crucial for your business’s success.


Drag & drop your metrics
No-code editor
Fully customizable
Trusted by 20,000+ growing businesses


Explore all the different ways you can use Databox to gain better data insights needed to drive better business decisions. Discover our pre-built templates from various integrations that businesses use on a daily basis to improve performance.
Whether you are looking for client reporting dashboards, agency dashboards, marketing dashboards, or sales dashboards, Databox can help you build them.
Let us know what you are trying to build and our team of experts will help you turn your data into actionable insights.
Book a call


Connect your datasources and instantly see your data in this template.
Creating your account...