Uses one-click integrations:
If you don't use Google Analytics 4 or Shopify, you can pull data from any of our 130+ one-click, native integrations or from spreadsheets, databases and other APIs.
Try this dashboard for free-
Average Session Duration
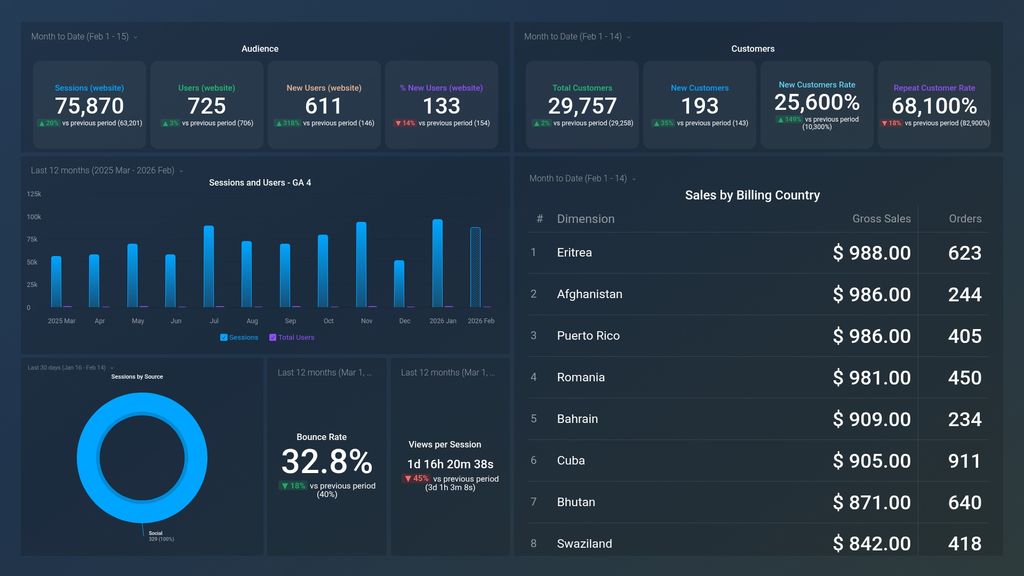
Average Session Duration is the average length of time visitors spend on your website during a single session, measured in seconds. This metric provides insight into visitor engagement and can help identify areas for improvement in site content or user experience.
-
Bounce Rate
Bounce Rate is a metric in Google Analytics that represents the percentage of visitors who leave a website without interacting with other pages or elements on the site.
-
New Customers
The New Customers metric measures the number of unique visitors who have made a purchase on a Shopify store for the first time during a given period.
-
Orders by Billing Country
The Orders by Billing Country metric shows the number of orders placed by customers based on their billing country. It helps track the geographic distribution of sales and is useful in making decisions related to marketing and advertising strategies.
-
Gross Sales by Billing Country
Equates to product Selling Price x Ordered Quantity during the specified Date Range split up by Billing Country.
- New Customers Rate
- Repeat Customer Rate
-
Total Customers
Total number of Customers gained.
