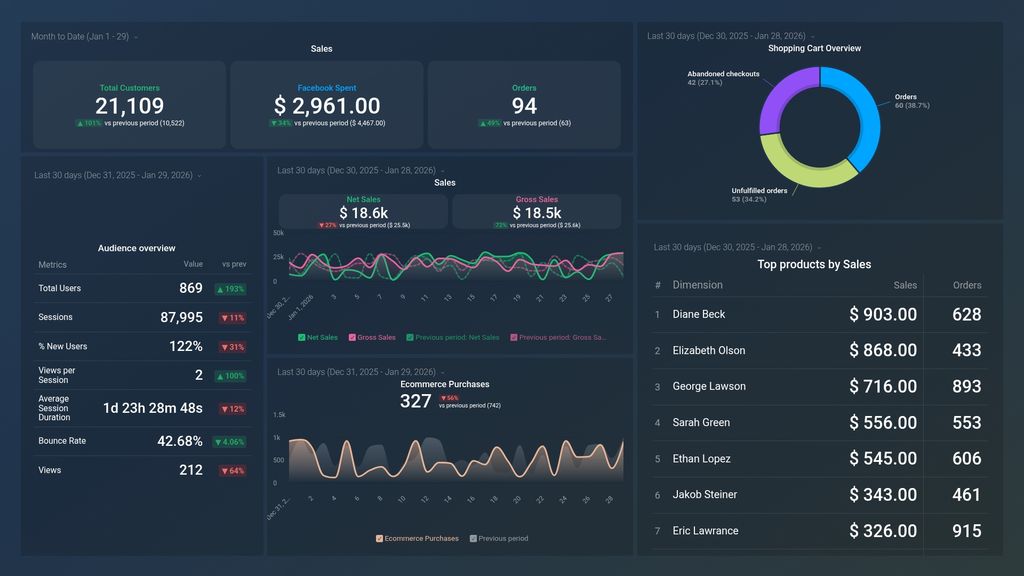
Use this free, easy-to-use, and customizable Shopify, Facebook & Google Analytics 4 Online Sales Dashboard to track and analyze online sales alongside Facebook Ads and Google Analytics 4. Gain insights into top product performance, eCommerce purchases, and audience overviews to make data-driven decisions that optimize store performance. This dashboard tracks key metrics such as Total Customers, Facebook Ad Spend, Orders, Audience Overview, Sales Performance (Gross Sales & Net Sales), eCommerce Purchases, Shopping Cart Overview (Abandoned Checkouts, Unfulfilled Orders, Orders), and Top Products by Sales.
By integrating with Shopify, Facebook Ads, and Google Analytics 4, this dashboard ensures seamless data tracking and analysis, helping you enhance your marketing and sales strategies.
If you don’t use Google Analytics 4, Facebook Ads or Shopify, you can pull data from any of our 100+ one-click, native integrations or from spreadsheets, databases and other APIs.
Average Session Duration is the average length of time visitors spend on your website during a single session, measured in seconds. This metric provides insight into visitor engagement and can help identify areas for improvement in site content or user experience.
Net sales is the total sales revenue generated by a business after accounting for returns, discounts, and other deductions. It is a key metric to measure a company's profitability.
Unfulfilled orders is a metric that measures the number of orders that have not yet been shipped or delivered to the customer. It helps merchants keep track of outstanding orders and ensure timely fulfillment.
Equates to product Selling Price x Ordered Quantity during the specified Date Range. Gross Sales does not include Discounts, Returns, Taxes, or Shipping.
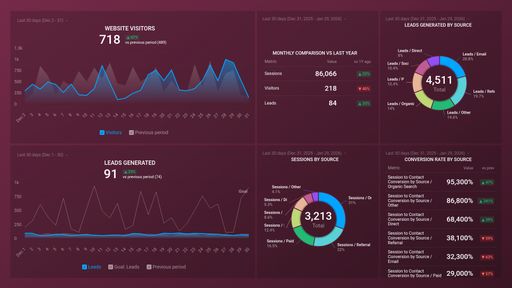
A streamlined overview of the SaaS customer acquisition funnel, tracking key stages from websites to lead generation and conversion, providing insights into customer acquisition rates, engagement, and overall funnel performance.
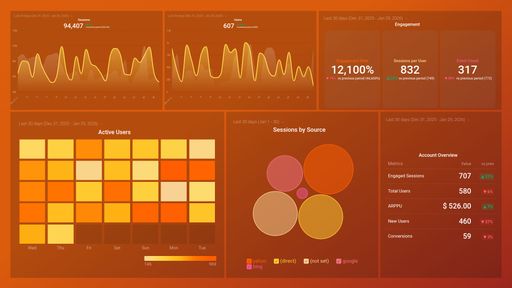
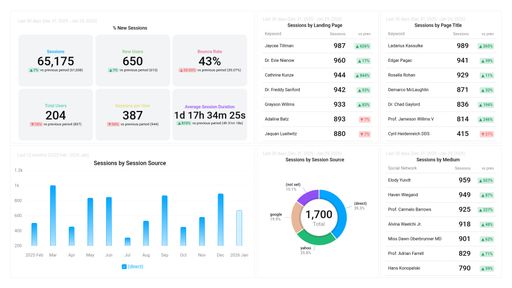
Google Analytics (Acquisition) dashboard template goes deeper into your Sources and reveals which marketing campaigns have been most productive.
Sometimes, you’ll want to dive deeper into performance. When you need to customize this template (or any other dashboard) to include different metrics, add metrics from different sources, etc., you can do so by using Databox’s Dashboard Designer.
The Designer allows you to easily drag-and-drop metrics and visualizations from any data source right into your dashboard.
Everyone starts with a 14-day trial of our Growth plan, accessing all features. Then choose a plan that best suits your needs, including a Free Forever plan.
Creating your account...