


Already have an account? Sign in
Sign up for free
Connect your datasources and instantly see your data in this template.
Creating your account...
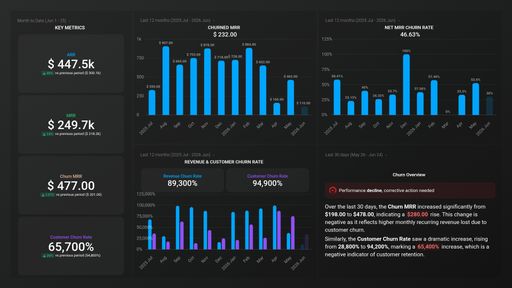
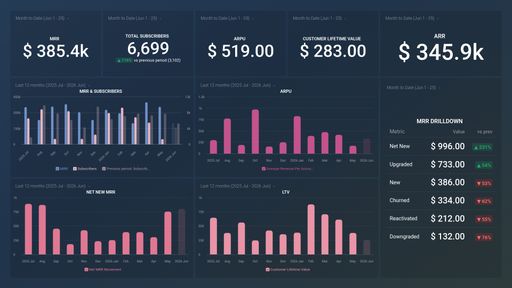
A ChartMogul dashboard is an interactive tool for tracking, visualizing, and analyzing the most critical SaaS metrics. It centralizes and visually displays key performance indicators (KPIs), helping make informed decisions to optimize subscriptions and drive sustainable revenue.
A comprehensive ChartMogul dashboard should track core SaaS metrics like MRR (Monthly Recurring Revenue), ARR (Annual Run Rate), Subscribers, Leads, Customer Churn Rate, and more. These metrics provide crucial insights into revenue trends, customer acquisition and retention strategies, and the overall success of your subscription business model.


Drag & drop your metrics
No-code editor
Fully customizable
Trusted by 20,000+ growing businesses


Explore all the different ways you can use Databox to gain better data insights needed to drive better business decisions. Discover our pre-built templates from various integrations that businesses use on a daily basis to improve performance.
Whether you are looking for client reporting dashboards, agency dashboards, marketing dashboards, or sales dashboards, Databox can help you build them.
Let us know what you are trying to build and our team of experts will help you turn your data into actionable insights.
Book a callCompare
Databox Inc.
HQ: Boston, MA, USA
AI-powered analytics for teams that need answers now.
Databox Inc.
HQ: Boston, MA, USA

AI-powered analytics for teams that need answers now.


Compare
Connect your datasources and instantly see your data in this template.
Creating your account...