Uses one-click integrations:
-
 ChartMogul
If you don't use ChartMogul, you can pull data from any of our 130+ one-click, native integrations or from spreadsheets, databases and other APIs.
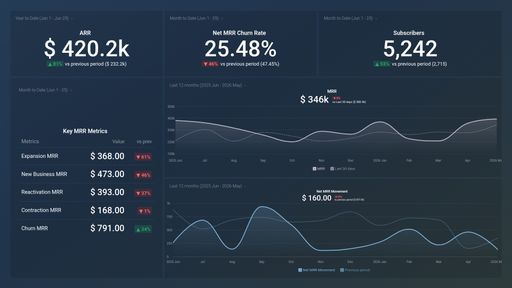
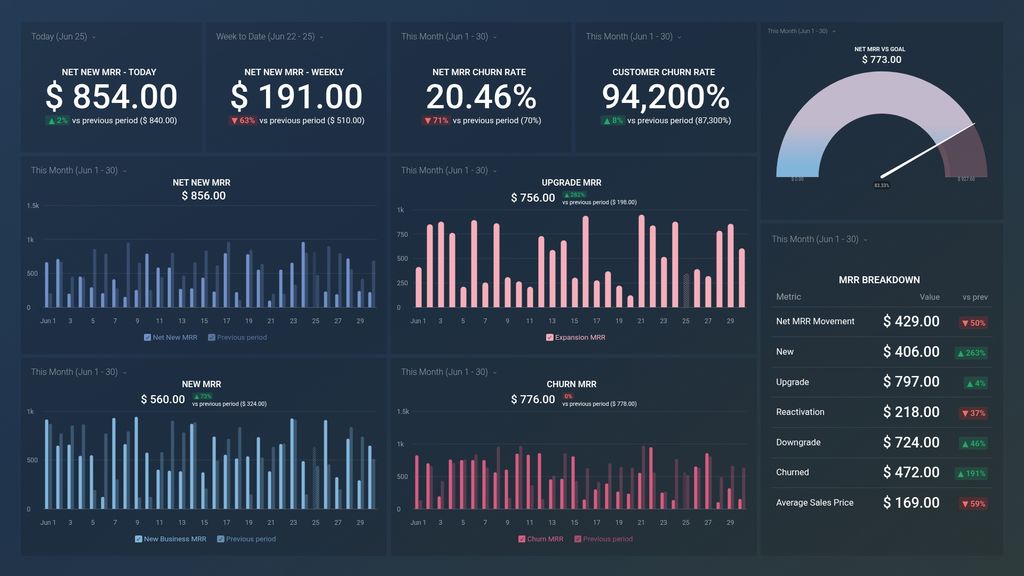
Try this dashboard for freeWhat you’ll learn from this ChartMogul SaaS MRR Drilldown (Weekly Monitoring) - ChartMogul Dashboard Template
Get quick updates on your revenue reporting KPIs without hassle. Connect your ChartMogul account and learn:
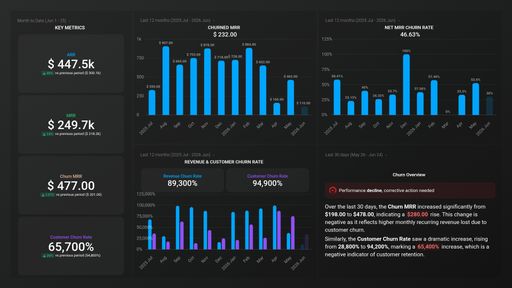
- How do you keep track of weekly new MRR Keeping an eye on your weekly New MRR changes can help you forecast whether or not you will be able to reach MRR your goals.
- How do you keep track of your churned MRR? For a SaaS company churned MRR is one of the biggest issues. Monitoring this metric can help you understand and forecast your business growth better. Also you will know when it is time to take action to reduce the churn if possible.
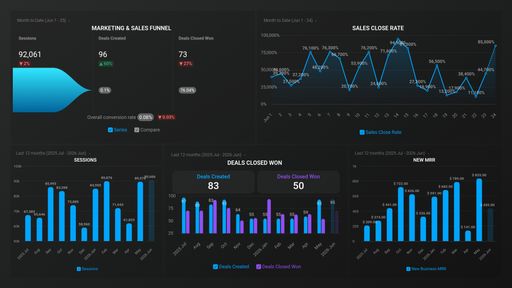
- How to track your new MRR week over week ? Monitor your new MRR each week and compare it to the previous at a glance. You will be easily able to see if there is a rising or declining pattern and take action accordingly.
- Will you reach your New MRR Goal? Monitor your new MRR each month and compare it to the goal you have set. You will be easily able to see if there is a rising or declining pattern and take action accordingly.
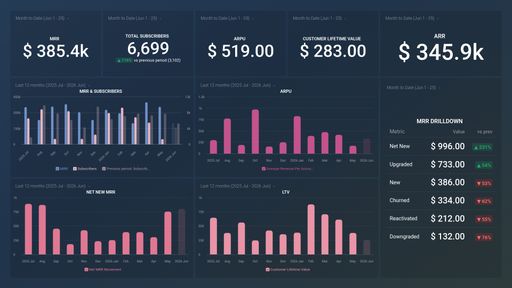
- MRR
- ARR
- Customer Churn Rate
- Average Revenue per Account
- Average Sales Price
- Refunds
Pull additional data using our deep integration with ChartMogul
What other financial metrics can you track and visualize with our ChartMogul integration? Among others:
There are many different metrics and metric combinations you can track using this integration. And in Databox, you can quickly visualize your most important financial metrics in various ways to help you create consolidated reports.
Read more about Databox’s ChartMogul integration.
ChartMogul metrics included in this template
-
Average Sale Price
The Average Sale Price metric calculates the average price of each sale made by a company, providing a snapshot of pricing trends and revenue generation.