Uses one-click integrations:
-
 HubSpot CRM
-
 QuickBooks
-
 ChartMogul
If you don't use HubSpot CRM, QuickBooks or ChartMogul, you can pull data from any of our 130+ one-click, native integrations or from spreadsheets, databases and other APIs.
Try this dashboard for freeWhat you’ll learn from this SaaS Financial Dashboard (ChartMogul + QuickBooks + HubSpot) Dashboard Template:
Connect your ChartMogul, QuickBooks, HubSpot CRM, GA4, and Hubspot accounts and learn:
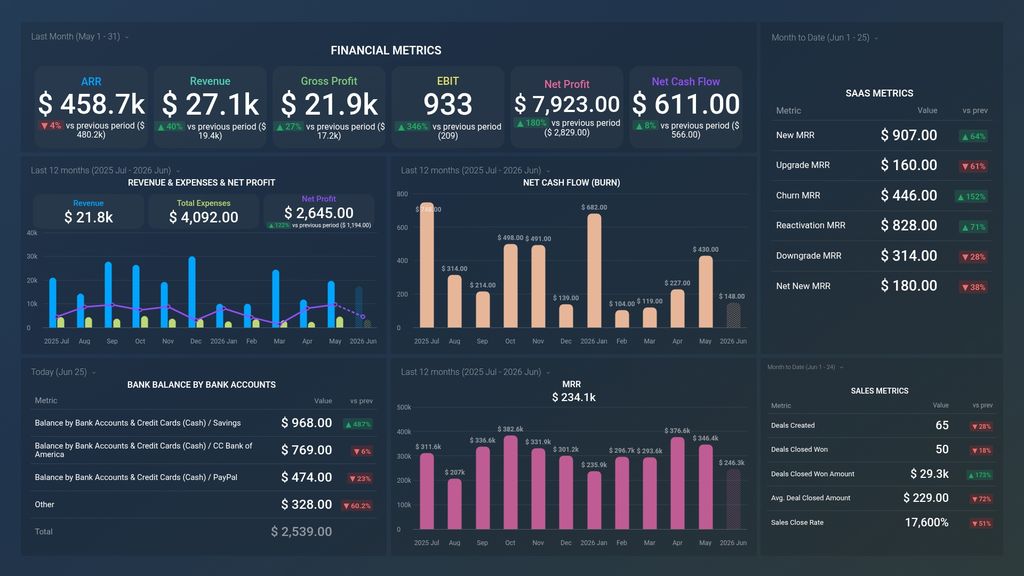
- How to track your most important SaaS metrics? By tracking metrics like Sessions, Signups, Upgraded MRR, Reactivation MRR and more in real time, you can gain insights into your business growth. And in case any of them are significantly trending down you can take steps to fix the possible causes of that trend.
- How to decipher your gross profit margin Investigate your business's profitability by focusing on your gross profit margin. This crucial figure highlights your financial gains post the subtraction of business-related expenses. Comparing these figures over various periods sheds light on your company's developmental progress.
- How do we track our monthly recurring revenue? View the total amount of revenue you expect to make regularly. Monitor your business’ health and growth by keeping an eye on the following metrics: New MRR, upgrades, downgrades, revenue churn, and so much more.
- What can I learn from my key sales metrics? Explore the dynamics of your sales achievements by analyzing essential sales indicators. Assess the aggregate deals concluded, the mean transaction value, and the overall success rate. This evaluation offers a snapshot of your sales team's productivity levels.
- How do I track a bank transaction? Delve into the specifics of your financial standing by meticulously reviewing your bank account balances. This method facilitates an analytical look at present finances in relation to historical data, enhancing your financial management capabilities.
Pull additional data using our deep integration with ChartMogul, QuickBooks, and HubSpot CRM
What else can you track and visualize with our robust integration with ChartMogul, QuickBooks, and HubSpot? When it comes to your most important payment metrics, churn, etc, almost anything:
- Gross and Net volume
- Customer retention rate
- Growth Rate
- Revenue Retention Rate
- Conversion Rate
There are many, many different metrics and metric combinations you can track using ChartMogul, QuickBooks, and HubSpot CRM. And in Databox, you can quickly visualize dozens of ChartMogul, QuickBooks, and HubSpot CRM metrics & KPIs in a variety of ways, alongside all the important metrics from other data sources you’re using.
Read more about Databox’s ChartMogul, QuickBooks, and HubSpot CRM integrations.
Explore more QuickBooks dashboards, HubSpot CRM dashboards, and ChartMogul dashboards.
QuickBooks metrics included in this template
-
Balance by Bank Accounts & Credit Cards (Cash)
Displays current balances from linked bank and credit card accounts in QuickBooks, providing a complete snapshot of your financial position.
ChartMogul metrics included in this template
-
Contraction MRR
Contraction MRR measures the loss in Monthly Recurring Revenue (MRR) due to downgrades or cancellations by existing customers.
-
Expansion MRR
Expansion MRR measures the increase in Monthly Recurring Revenue from existing customers due to upsells, cross-sells, or pricing changes. It quantifies the revenue growth generated by expanding relationships with current customers.
-
Net MRR Movement
Net MRR Movement is a metric that measures the overall change in monthly recurring revenue (MRR) by considering both positive and negative changes, giving a comprehensive view of how MRR is trending over a specific period of time.
-
Reactivation MRR
Reactivation MRR measures the monthly recurring revenue generated from previously churned customers who have been successfully reactivated.