Uses one-click integrations:
-
 HubSpot CRM
If you don't use HubSpot CRM, you can pull data from any of our 130+ one-click, native integrations or from spreadsheets, databases and other APIs.
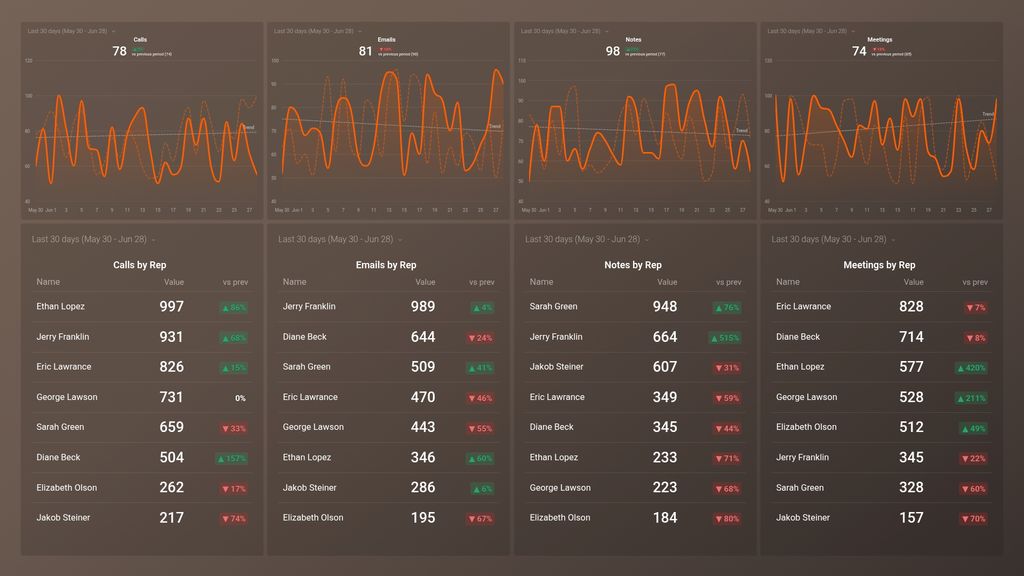
Try this dashboard for freeWhat you’ll learn from this HubSpot (Sales Activity) Dashboard Template
- How do I track the email productivity of my sales reps? Track and compare side-by-side the number of emails sent, received, and responded to by each sales rep during a given time period. Measure their actual results against the set targets/goals for the week/month/quarter. Tracking this data lets you know as a manager who both your top and underperforming sales reps are when it comes to emails. Also, you can consider if specific strategies and motivators need to be set in place to boost performance.
- How many calls did my sales reps make and receive last week? Track the number of calls made and received by each of your sales reps within a given time. Compare the productivity and performance of your sales reps for the current day/week/month/quarter to the previous time period. Tracking business calls is crucial as your business cannot generate revenue and increase profits if calls are not being made.
- Which sales rep had the highest number of prospect and client-facing meetings last month? Find out how many meetings each of your sales reps has daily. Are your sales reps getting enough meetings booked and held? If not, dig in to understand why. With this data, you can then take a step further to measure the quality of these meetings and if they ultimately lead to leads moving down the sales funnel faster.
- How many meetings have your team had with prospects this week? View the total number of meetings booked and held with your sales representatives within a specified time period. Monitor this data daily to ensure your sales reps are hitting and exceeding their targets. Take a step further to gauge if these meetings actually result in conversions or if your marketing team needs to do better in generating better-qualified leads.
- How many emails did your sales team send and receive last week? See how many emails your sales representatives send, receive, and respond to daily, weekly, or monthly. By tracking this data, you’ll be able to identify which day(s) your team receives the most emails and if these emails actually help your prospects move to the next stage of the sales funnel.
- Do my sales representatives take notes during a call? It is good practice for your sales representatives to take notes during calls as it helps retain information, enhances collaboration, and helps your team stay on top of deals. Bearing this in mind, use this dashboard to track the total number of notes taken by your sales team combined and by each of your sales reps.
Pull additional data using our deep integration with HubSpot.
What else can you track and visualize with our integration with HubSpot CRM? When it comes to leads, sales & revenue, almost anything:
- Sales pipeline and leaderboards
- Calls and meetings booked
- Meetings by owner
- Deals by stage
- Closed Won (and lost) deals
- Sales activity by sales rep, and more
In Databox, you can quickly visualize 100s of HubSpot metrics in various ways, alongside all the important metrics from other data sources you’re using.
Read more about Databox’s HubSpot CRM integration.
Explore more HubSpot CRM dashboards.
HubSpot CRM metrics included in this template
-
Calls by Owner
The Calls by Owner metric in Hubspot CRM tracks the number of phone calls made by individual owners and displays the data in a user-friendly report.
-
Emails Logged by Owner
The Emails Logged by Owner metric in HubspotCRM measures the number of email interactions logged by an individual owner within a given period, indicating their level of engagement with leads and customers.
-
Meetings by Owner
The Meetings by Owner metric shows the number of meetings scheduled and owned by each user in the Hubspot CRM, enabling you to track individual productivity and performance in terms of setting up meetings with prospects and clients.
-
Notes by Owner
Notes by Owner metric tracks the number of notes added by each individual owner in a Hubspot account, enabling efficient communication and collaboration among team members.