Table of contents
What if you could tell, ahead of time, which deals would close and where leads get stuck or drop off in your sales cycle?
That’s essentially the purpose of maintaining an accurate sales pipeline.
But, an effective sales pipeline must work across departments––is marketing generating enough traffic and leads? Is sales making enough connect calls? Setting up enough meetings? The list goes on…
Therefore, in order to maintain an accurate sales pipeline, you need to be tracking the right KPIs in your sales dashboard. So, which ones matter most? We asked a few dozen sales pros for their thoughts.

But first…
What is a Sales Pipeline?
A sales pipeline is the stages a customer passes through before becoming a customer.
These stages vary company-to-company. However, each has four distinctive stages no matter what item you’re selling. That includes:
- Lead Generation: Driving people to your website and building their interest in your product or service.
- Lead Qualification: Checking whether the leads you’ve generated actually have an intent to purchase, and fit your buyer persona.
- Proposal or Quote: Delivering a custom quote, or showing pricing, to the qualified lead.
- Sale: They commit to the sale and pay for the item.
Browse through these free sales pipeline dashboard examples here.
10 Sales Pipeline KPIs for Tracking & Forecasting Sales
Now we know what a sales pipeline is, you might be wondering how effective yours is.
After all, if people don’t pass from one stage to the next, they’ll get stuck in the pipeline–and won’t end up being a customer.
But monitoring your sales pipeline helps to spot those places where leads get stuck. That means you’re able to fix them and keep more leads passing through to the conversion stage.
We asked 25 sales experts to share the KPIs they’re using to track their company’s sales pipeline. That included:
- On-site activity metrics
- Number of initial presentations
- Email response rate
- MQL to SQL conversion rate
- Number of sales opportunities
- Quote to close ratio
- Sales cycle length
- Number of touchpoints
- Projected sales value
- Average revenue per account
PRO TIP: Monitor Your Sales Team’s Performance in One Dashboard
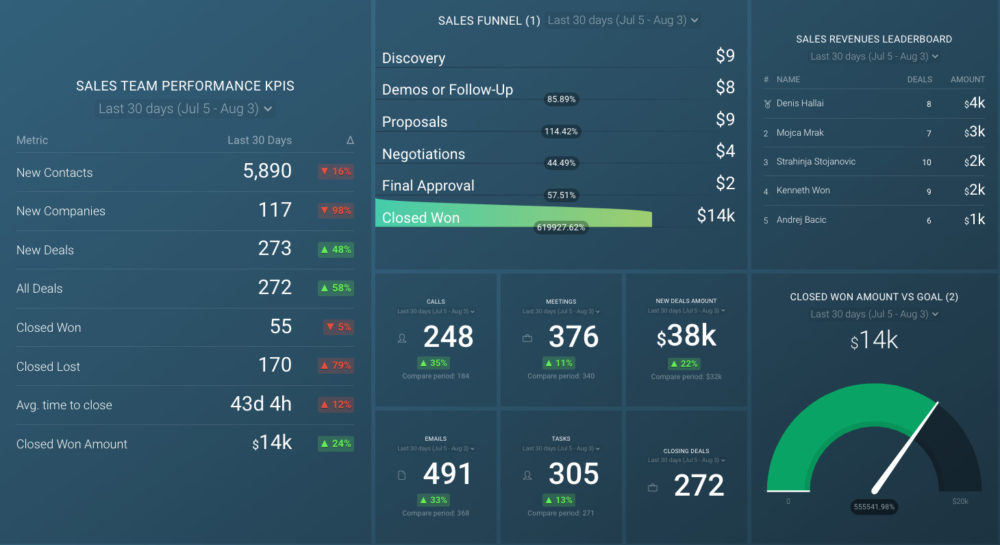
Smart Sales Managers know that to achieve your monthly and quarterly goals, you have to monitor your team’s sales performance on a daily, weekly, and monthly basis. To do that, you need an actionable dashboard that summarizes both team and individual sales rep metrics and allows you to:
- Understand the current sales pipeline.
- Track sales rep performance.
- Compare team results to revenue goals.
If you use the HubSpot CRM, you can benefit from the experience of our sales experts, who have put together a plug-and-play Databox template showing some of the most important metrics for monitoring your sales team performance. It’s simple to implement and start using as a standalone dashboard or in sales reports!
You can easily set it up in just a few clicks – no coding required.
To set up the dashboard, follow these 3 simple steps:
Step 1: Get the template
Step 2: Connect your HubSpot account with Databox.
Step 3: Watch your dashboard populate in seconds.
1. On-site Engagement Activity
Visiting your website is often one of the first ways a lead expresses their interest.
But aside from bog-standard metrics like pageviews and sessions, our experts advise tracking certain on-site KPIs to measure your sales pipeline:
- Form Submissions: Irene Lopez of Online Optimism thinks “a great KPI to measure is form submissions. Whenever a potential lead heads to your site and fills out a form for “More Information” or to “Get a Quote” you are measuring how many potential leads you’ve got.”
- Online Bookings: Being in the service industry and not having an ecommerce checkout, knowing when people are clicking to book online at least gets us near the end of the sales funnel and allows for us to move advertising dollars where online booking clicks are driven,” says Elizabeth Kuerth of Quality Comfort Home Services.
Related: The 14 Website Engagement Metrics Every Marketing Team Should Be Tracking
2. Number of Initial Presentations
“If I only had 1 metric to measure the health of my sales department, I would probably say “initial presentations” (IPs) or what we refer to as “converted leads,” writes Netbooknews‘ Kenny Trinh.
“If we know our win rate from the initial presentation to closed-won, we can forecast monthly sales accurately.”
This ties in with the monthly frequency that’s most popular when setting new sales KPIs:

…which also ties into sales reporting, too:

Trinh continues: “In our sales funnel, the initial presentation is the first stage. Therefore, by measuring a number of IPs and assuming an average deal size, we know how much pipeline we are creating and whether or not we are scaling our business.”
“On a sales rep basis, we can see the impact of prospecting and rank performance based on this KPI.”
Use this sales performance dashboard to track the performance of individual sales team members and measure your team’s progress against set targets.
3. Email Response Rate
Did you know that the average person deletes 48% of the emails they receive on a daily basis?
Sure, having your emails opened means you’re already onto the right track. But “the one sales KPI I always track is the response rate because it is an indicator that the recipient of your email is interested in your content,” says Anh Trinh Trinh of GeekWithLaptop.
“This also makes the response rate a good measure of how interesting or how engaging your emails are. You can also use it as a metric to determine if your content is engaging or not as well. Low response rates typically mean that your content is lacking or that you are targeting the wrong customer.”
Similarly, Kristel Staci adds that BloggingTips.com “likes to track email to click to conversion ratios through our site and mailing list.”
“While you might have a lot of subscribers on your list, how many of them are actually opening, reading and converting? These KPIs will tell you exactly that.”
4. MQLs to SQL Conversion Rate
There are two types of lead you’ll need to consider when measuring your sales pipeline. Those are:
- Marketing Qualified Leads (MQL): People who’ve entered their details in return for content, such as whitepapers, lead magnets, or webinar registrations.
- Sales Qualified Leads (SQL): Leads passed from marketing teams that actually fit buyer personas, and have an intent to purchase.
“Not all leads are the same,” writes Virtina‘s Nitin Chacko Kovelil. “I consider the ratio of leads to sales qualified leads as the most important KPI.”
“It could help find the lead generation strategies which are working fine. I’m able to realize whether our marketing is encouraging suitable prospects to contact us.”
Similarly, Manish Dudharejia of E2M Solutions adds: “Our goal is to always use our resources carefully. Therefore, we pay close attention to how qualified a lead is by looking at the information they provide, including what they need, their budget, etc.”
“By carefully measuring this KPI, we improve our sales and avoid giving bad leads to our account managers, leading to more efficient sales procedures.
Dudharejia continues: “A qualified lead might vary from company to company. It’s all about looking at the buyer’s persona and personal information to determine if they’re the kind of lead that would actually go through with a purchase and benefit from the products/services you offer.”
Summarizing, Brandon Amoroso of electrIQ marketing says: “While it’s great if you have 500 leads coming in per month, it means nothing if none of them are actually qualified. We’d rather have 250 leads and 25 qualified than 500 leads and 20 qualified!”
Use this sales leads dashboard to get a high-level overview of all the sales qualified leads in your funnel.
Related: 11 Ways to Improve Lead Quality According to 40 Marketing & Sales Experts
5. Number of Sales Opportunities
An SQL means your lead has an intent to purchase. We can call these sales opportunities.
“Sales opportunities indicate the success of your strategies,” writes Melanie Musson of HomeInsuranceRates.com.
“This is where the rubber meets the road. A sale opportunity means you came close. If you measure what happens after the opportunity (do they convert?) you can understand what approaches during the opportunity are most successful.”
6. Quote to Close Ratio (or Conversion Rate)
“We track many KPI’s but one of the most important is the Quote to Close ratio,” writes Kirby Wilkerson of The Impact Kind.
“Why we look at this more than some of the others is because it lets us know what emails, conversations, keywords actually sell our services the best. That’s what allows us to see what’s working, what needs to change, and tracking this actually keeps us growing in sales and in our creative efforts to drive even more revenue.”
Elmer Taboada’s team at East-West-Bridge also calls this a sales inquiry conversion rate: “Although most people will say that the revenue from your business operations is the most crucial KPI to analyze, the data it provides is not enough.”
“With the conversion rate, you know if your current sales funnel works better than previous funnels. You split test with a quantifiable metric (your old funnel’s data) to compare the performance of a newer funnel. In doing so, you will always choose the better option among the two.” Use this sales funnel dashboard to assess the performance of your sales funnel.
Similarly, Growth Hackers‘ Jonathan Aufray adds: “Close rate is the sales pipeline KPI we track to improve sales.”
“We don’t just want traffic and cold leads. What we want is warm or hot qualified and targeted leads. If the leads to sales close rate is high, we know that our leads are targeted and qualified and this is crucial to decrease the close rate and close time.”
Planet Content‘s Obaid Khan agrees: “It consistently shows you how many people converted on the first call, the second, and the third. It also tells you which sales folks are performing better. This way, you can keep track of all the effort while improving sales by focusing on the kinds of customers that convert on the first call (call means people clicking on the CTA).”
And you want to easily track and visualize how many sales are closed by your individual sales reps, check out this data snack on how track Close Rate by Sales Rep in HubSpot CRM with Databox.
Summarizing, Maxburst‘s Andrew Ruditser says: “If we have a high conversion rate, that means our strategies are working and interesting our users. If our conversion rates are decreasing then we need to figure out new strategies to get our users to complete the action we desire.”
Editor’s note: Did you know that you can get KPI performance alerts in Slack? Connect your data and start receiving performance insights directly in Slack now.
7. Length of Sales Cycle
“One sales pipeline KPI that should be tracked is the length of your sales cycles,” writes Colin Mosier of JSL Marketing & Web Design.
“It is important to measure this metric because it can give you an idea of how to manage your time and team. Once you have an idea of how long a typical qualified customer is in your sales cycle, you can plan for when you expect each of the sales in your pipeline to close. Understanding this will help you prevent a bottleneck from forming in the workflow.”
You might also see this KPI named time to conversion–something uAcademy‘s Jay Lee also thinks “is a very important KPI in a sales pipeline and it’s essential to increasing sales.”
“For example, if one of the steps in your sales pipeline has a long time to conversion, this could affect the overall conversion rate as the extended wait time could cause customers to lose interest in the product/service. But improving the transition times of the funnel could help increase sales and keep potential customers interested in your product or service.”
Paige Arnof-Fenn of Mavens & Moguls adds: “Sales cycle length is key because it tells you how efficient your sales process is and helps you forecast sales more accurately.”
Charlotte Utton explains that Six & Flow “set an average time of 60 days and we can track whether we’re over or under and use the data to plan resource and capacity requirements, and assess our overall sales cycle – rather than just slotting in deals as and when they happen.”
“Also, because we operate a team-first approach we have a slightly longer sales cycle and it’s important to us that sales aren’t going through too quickly, as well as monitoring those which go over the average.”
“If closed sales consistently fall under the average time, we know that we’re not doing the work to make sure that one, we’re a good fit for the client, but also that they’re a good fit for us and the team – which is something we focus a lot on,” Utton continues.
“When data tells us the sales cycle has been too short, we know that we likely haven’t taken prospects through our full process and it’s something we can fix.”
8. Number of Touchpoints
We know that the length of each sale is important. But according to Jeremy Cross of Team Building Phoenix, you should also track “the number of touchpoints, which is the cumulative sum of phone calls and emails we send to a lead.”
“We’ve found that it takes an average of seven touches to connect with someone and have an actual sales call. Maintaining that volume is critical to both maintaining and improving our sales.”
Plus, Home Grounds‘ Alex Azoury says: “Evaluating how many touchpoints a prospect has with our marketing content and sales team members is well worth noting for its impact on customer acquisition cost.”
“Another way of looking at it is to improve messaging and sales flow. Are we simply making customers jump through too many hoops? Or, by contrast, are we forcing them to make a decision before they have enough information?”
Track your call volume and sales team activities at any given time using this call tracking dashboard.
9. Projected Sales Value
“You should ALWAYS know the sum of forecast deals in your pipeline,” Altitude Marketing‘s Adam Smartschan says. “We calculate this as (% chance of closing)*(sum of total proposed contracts).”
“This is a tremendous gut check for the health of your pipeline. It’s not a sophisticated metric, but that’s the point. It’s a one-number view of how you’re tracking. I call it my “sleep at night” metric – if it’s above $X in any given report, I can rest easy. If it’s below $X, it’s time to change something.”
Jamie-Lee Kay of The Other Straw agrees: “In our CRM I find it critical to track our projected deal or sales value. This helps us track our monthly projected sales revenue.”
Use this business development dashboard to monitor your potential buyers as they move from one sales stage to the next.
10. Average Revenue per Account
Another financial metric to track for your sales pipeline comes from Anton Ross’ team at Upgrow, Inc in the form of “Average Revenue Per Account (ARPA), tracked by business segment.”
“ARPA is invaluable for comparing groups or cohorts of accounts by month, exposing trends in account expansion and contraction.” This metric can be tracked easily using a sales dashboard software.
Hush Blankets‘ Lior Ohayon adds: “Not only is this extremely important in terms of overall sales, it is a great way to determine referral purchases. Most of the time if somebody purchases more than one non consumable item, it is meant as a gift for a friend or relative.”
Michael Bacon of Moxie Media Maritime Security Training calls this Customer Lifetime Value (CLV), which they say is “an important sales pipeline KPI to track, measure, and use to improve my company’s sales.”
“CLV is possibly one of the most underutilized sales KPIs within B2B organizations. When using this metric, you can predict what will happen in future sales, because the CLV gives you insight regarding how much profit the average customer generates over a long-term period.”
“This allows you to focus on the amount of spending required to obtain new customers, create retention strategies to keep those customers and identify your most valuable customers,” Bacon continues.
“Many sales experts understand that it’s substantially more expensive to acquire new customers than keep current ones. Customer Lifetime Value helps sales leaders to increase sales growth every year when used properly.”
How effective is your sales pipeline?
These sales pipeline KPIs are the starting point to understanding how well people pass through your sales funnel.
With them, you’ll be able to spot which stages are successful at pushing leads towards a purchase, and which aren’t. You can then prioritize plugging those holes and boost your overall sales conversion rate.
Need an update on your sales pipeline KPIs? Databox Scorecards send you updates on your key performance indicators through email, mobile push notification, and/or Slack every day, week, or month.