


Table of contents
Have you heard this quote from Edwards Deming? – “In God we trust, all others bring data.”
In today’s competitive landscape, if you’re not measuring your performance and closely analyzing each relevant data point, you’re not going to see much success with your strategies.
This is the golden rule no matter what type of business you run – whether you’re a small, local jewelry store or Coca-Cola.
And KPIs (key performance indicators) help us do just that.
A KPI is a measurable value that helps organizations track and evaluate their progress toward achieving specific goals.
But if you’re looking to better understand KPIs, how to use them, how to develop them, and how to properly track them in your business, this standalone definition won’t to cut it.
So in this article, we’ll roll up our sleeves and get into the nitty-gritty of everything KPI-related you need to know to take advantage of them in your own business.

Let’s get started.
- What is a Key Performance Indicator (KPI)?
- Why Are KPIs Important?
- What Are KPIs Used for?
- What is the Difference Between KPIs and Metrics?
- Types of KPIs (Key Performance Indicators)
- How to Develop KPIs
- How to Measure KPIs
- KPI Examples
- KPI Best Practices
- Streamline KPI Monitoring and Reporting with Databox
What is a Key Performance Indicator (KPI)?
A Key Performance Indicator (KPI) is a measurable target that’s used to quantify progress toward important business objectives and evaluate the success of an organization, specific department, project, or individual.
KPIs provide quantifiable and objective data that helps organizations track their progress and make informed decisions, making it mandatory practice for any type of business.
Why Are KPIs Important?
KPIs aren’t just another buzzword – they play a pivotal role in helping businesses hit their goals and scale properly.
Here are some of the main reasons why KPIs are so important:
- They bring clarity and help you focus: KPIs provide clarity by defining specific, measurable objectives. This way, everyone within an organization is aligned and focused on common goals. It leaves no room for confusion and promotes a shared understanding of what success looks like.
- Helps measure success: KPIs are one of the best yardsticks for measuring success. By quantifying your progress, they provide a clear picture of whether you’re moving in the right direction.
- Ensures informed decision-making: Informed decisions are rooted in data, not intuition. KPIs provide data-driven insights that enable more informed, strategic decision-making. When you have access to accurate KPI data, you can adjust your strategies as needed.
- Bring transparency and accountability: KPIs create a sense of accountability. When individuals or teams are responsible for specific KPIs, they are more likely to take ownership of their work.
- Crucial for benchmarking your performance: With KPIs, you can compare your performance against industry standards, competitors, or your own historical data. In general, benchmarking is one of the best ways to know whether your strategies are on par or they need to be optimized.
What Are KPIs Used for?
KPIs serve a variety of purposes.
Primarily, they’re used to assess and measure the performance of different aspects of a business.
Whether it’s sales, marketing, customer service, or production, KPIs provide tangible data that indicates how well these areas are performing.
They’re also instrumental in tracking progress toward specific objectives. Using them, companies can break down their broader goals into smaller, measurable components.
And once you have all the performance data ready, you can use it for data-driven decision-making.
When backed by KPIs, decisions become more objective and less reliant on gut feelings (as they should be).
What Is the Difference Between KPIs and Metrics?
KPIs and metrics are often used interchangeably, but they serve different roles.
Metrics present a broader category that encompasses any quantifiable data point used to measure performance, track progress, or analyze various aspects of an operation.
They can include a wide range of data, such as revenue, website traffic, customer satisfaction scores, and employee turnover rates. They provide a comprehensive view of an organization’s activities but may not always be directly tied to strategic objectives.
In essence, metrics are the building blocks of data analysis. They’re useful for monitoring day-to-day operations and providing a foundation for more detailed analysis.
KPIs, on the other hand, are a specific subset of metrics.
KPIs are carefully selected metrics that are directly aligned with an organization’s strategic objectives. They represent the most relevant data points that have a direct impact on an organization’s success.
In other words, KPIs are the metrics that matter the most. They’re not just about tracking progress but also about measuring success.
Once you understand how KPIs differ from everyday metrics, the next step is making sure each KPI is tied to a specific business outcome and reviewed in a consistent cadence. A structured system like Databox OKR Software helps teams translate broader goals into clear objectives and measurable key results, so KPIs aren’t tracked in isolation. This makes it easier to assign ownership, keep teams aligned on what “success” means, and evaluate progress over a defined period (for example, monthly or quarterly) without losing sight of the bigger business priorities.
Types of KPIs (Key Performance Indicators)
Time to extend another olive branch – types of KPIs.
We’ve divided them into:
Strategic KPIs
Strategic KPIs are high-level metrics that focus on an organization’s long-term objectives.
In other words, they provide a big-picture view of how well an organization is progressing toward its strategic goals.
Here are some key types of strategic KPIs:
- Goals: Goals are specific, measurable targets that reflect the desired outcomes and success criteria at the highest level.
- Outcome metrics: Outcome metrics measure the final result of specific initiatives. They help assess the real-world effects of strategies and whether they are delivering the desired outcomes. For example, an outcome metric for a marketing campaign could be the increase in customer conversions.
- Benchmarks: Benchmarking involves comparing an organization’s performance to industry standards, competitors, or historical data. This type of KPI provides more context and helps determine whether the organization is ahead, on par, or behind in specific areas.
Instantly and Anonymously Benchmark Your Company’s Performance Against Others Just Like You
If you ever asked yourself:
- How does our marketing stack up against our competitors?
- Are our salespeople as productive as reps from similar companies?
- Are our profit margins as high as our peers?
Databox Benchmark Groups can finally help you answer these questions and discover how your company measures up against similar companies based on your KPIs.
When you join Benchmark Groups, you will:
- Get instant, up-to-date data on how your company stacks up against similar companies based on the metrics most important to you. Explore benchmarks for dozens of metrics, built on anonymized data from thousands of companies and get a full 360° view of your company’s KPIs across sales, marketing, finance, and more.
- Understand where your business excels and where you may be falling behind so you can shift to what will make the biggest impact. Leverage industry insights to set more effective, competitive business strategies. Explore where exactly you have room for growth within your business based on objective market data.
- Keep your clients happy by using data to back up your expertise. Show your clients where you’re helping them overperform against similar companies. Use the data to show prospects where they really are… and the potential of where they could be.
- Get a valuable asset for improving yearly and quarterly planning. Get valuable insights into areas that need more work. Gain more context for strategic planning.
The best part?
- Benchmark Groups are free to access.
- The data is 100% anonymized. No other company will be able to see your performance, and you won’t be able to see the performance of individual companies either.
When it comes to showing you how your performance compares to others, here is what it might look like for the metric Average Session Duration:

And here is an example of an open group you could join:

And this is just a fraction of what you’ll get. With Databox Benchmarks, you will need only one spot to see how all of your teams stack up — marketing, sales, customer service, product development, finance, and more.
- Choose criteria so that the Benchmark is calculated using only companies like yours
- Narrow the benchmark sample using criteria that describe your company
- Display benchmarks right on your Databox dashboards
Sounds like something you want to try out? Join a Databox Benchmark Group today!
Operational KPIs
Operational KPIs are metrics that focus more on an organization’s day-to-day activities. They help monitor the efficiency of various operations.
We can further divide them into:
- Processes: Process KPIs assess the quality of specific operational processes. They may include metrics related to production cycles, project completion times, or customer support response times.
- Input metrics: Input metrics measure the resources, materials, and effort invested in various operations. For example, in manufacturing, input metrics could include raw material consumption or labor hours.
- Output metrics: Output metrics evaluate the results of operational activities. These could include product quality, sales revenue, or customer satisfaction scores.
Functional KPIs
Functional KPIs assess the performance of specific functions within an organization.
Here are some of the key types of functional KPIs:
- Sales KPIs: These KPIs evaluate the performance of the sales department. Examples include revenue generated, sales conversion rates, and the average deal size.
- Marketing KPIs: Marketing KPIs assess the success of marketing campaigns and strategies. Metrics such as website traffic, lead generation, click-through rates, and customer acquisition are just some examples.
- Customer service KPIs: These focus on the quality of customer support. Metrics may include customer satisfaction scores, response times, resolution rates, and customer retention rates.
- Finance KPIs: Finance KPIs are related to financial performance. Examples include cash flow, profitability margins, and budget adherence.
Leading and Lagging Indicators
Leading indicators are forward-looking KPIs that provide early signals of potential changes in performance.
They help predict future trends and signal the organization to take proactive measures to maintain or improve current performances.
Some examples of leading indicators include website traffic or customer engagement levels.
Lagging indicators, on the other hand, are retrospective KPIs that measure the outcomes of past activities and provide insights into historical performance.
Examples of lagging indicators include revenue, customer churn rate, employee turnover rate, and product defect rate.
/marketi
How to Develop KPIs
How much research and effort you put into developing your KPIs can dictate the speed at which it takes you to reach your business objectives.
Here’s a step-by-step guide you can follow to develop effective KPIs:
- Define your objectives: Before creating KPIs, clearly outline your objectives. What do you want to achieve? Your KPIs should directly align with your organizational goals. For example, if your goal is to increase revenue, your KPI could be “quarterly revenue growth.”
- Identify the key metrics: Identify the specific metrics that will help you measure progress. Consider the KPIs we discussed earlier, such as strategic, operational, and functional.
- Consider both leading and lagging Indicators: Depending on your goals, incorporate both leading and lagging indicators into your KPI framework. Leading indicators can help you take proactive measures while lagging indicators provide retrospective insights.
- Involve relevant stakeholders: Collaboration is also crucial in KPI development. Make sure you involve relevant departments and stakeholders to ensure that KPIs are well-understood across the organization.
- Document your KPIs: Create a KPI documentation plan that outlines each KPI’s definition, measurement method, data sources, and responsible individuals or teams.
- Decide how you’ll track the KPI: Set up systems and tools to track and monitor your KPIs. Automated reporting and visualization tools can make this process more efficient.
- Regularly review and adjust: KPIs are not static. Periodically review your KPIs to assess their relevance and effectiveness. If your goals or strategies change, adjust your KPIs accordingly.
PRO TIP: Two more important things you also need to take into account during the development process are your financial model and past experiences. Each financial model has a unique roadmap for achieving business goals, so you need to make sure the KPIs you develop actually fit the bill. If you’ve developed KPIs in the past, draw the insights from that experience to see which indicators have historically driven success or highlighted potential issues. Why start from zero if you don’t have to?
How to Measure KPIs
Once you finish developing your KPIs, it’s time to start measuring them.
To measure KPIs properly, follow these best practices:
- Rely on the SMART Framework
- Choose the Right Tools for Measuring KPIs
- Visualize KPIs through Live Dashboards
- Create Standard and Customized KPI Reports
- Track a Limited Number of KPIs
- Revise KPIs on a Quarterly Basis
Rely on the SMART Framework
The SMART framework is one of the most valuable tools to ensure that your KPIs are well-defined (and actionable).
SMART stands for – Specific, Measurable, Achievable, Relevant, and Time-bound.
Your KPIs should be specific, so define precisely what you want to accomplish. Instead of a vague goal like “increase sales,” specify a KPI like “increase monthly sales revenue by 10%.”
There should also be a straightforward way to measure your progress. For instance, if your KPI is “reduce customer complaints,” define how you’ll measure complaints and set a target number.
Next up, you want to make your goals achievable. Are your KPIs realistic? Consider your resources, capabilities, and constraints when defining important KPIs.
KPIs should also be relevant and have a clear connection to the goal you’re actively trying to achieve. So if you want to get more organic leads, it’s only natural to track website traffic.
Lastly, set a specific time frame for achieving your KPIs and make them time-bound. For example, “increase website traffic by 20% in the next quarter.”
Choose the Right Tools for Measuring KPIs
Let’s talk tools.
While it’s certainly possible to track and measure KPIs manually, why waste countless hours (and nerves) when you can streamline the process with the right business analytics tools?
More often than not, tracking KPIs manually involves scouring through different tools and compiling all of your most relevant data in a separate spreadsheet – each time.
This quickly takes a toll on any marketer or business owner’s schedule.
But with specialized business analytics tools like Databox, you can handle this entire process in half the time. Actually, scratch that – you can do it in minutes.
You can create a dedicated dashboard for the KPIs you want to monitor, connect your data sources, and fill the dashboard with your most relevant metrics.
Each time you log into your dashboard, you’ll have real-time insights into what’s happening, all in one place.
Visualize KPIs through Live Dashboards
Another best practice when it comes to measuring your KPIs is to visualize them using a live dashboard so the data is more understandable.
Live dashboards offer real-time, interactive representations of your KPI data, making it easier to track, analyze, and respond to performance changes effectively.
In fact, about 60% of companies that hit more than 75% of their annual goals use live dashboards to share their findings.
And this is one of Databox’s strongest suits.
With Databox dashboard reporting, you get an all-in-one reporting tool that helps you visualize and analyze your data more simply and efficiently than ever before.
In a single place, you can build your dashboard, present it live to your team, and create detailed reports. No need to juggle through a dozen different apps.
Create Standard and Customized KPI Reports
Your reports should provide a clear and organized overview of your performance data.
They’re an essential part of your measuring process because they serve as a communication tool with stakeholders so they can easily understand the KPI information.
And if you want to streamline your reporting process, you should give Databox’s automated reporting tool a go.
Reporting is one of the most important processes within an organization, but until now, it’s also been one of the more tedious.
Swimming in spreadsheets and going back and forth between platforms shouldn’t be the standard operating procedure.
With Databox, you can automate this entire process.
You can build professional, deck-like reports in just minutes and add entire dashboards (and forget about screenshot reports).
Plus, once it’s ready, you can schedule sends and reminders to put the process on complete autopilot.
Track a Limited Number of KPIs
When it comes to measuring KPIs, one big mistake that many businesses make at the beginning is “data overload.”
Tracking too many KPIs simply isn’t feasible in the long run, and you end up adding even more confusion to your numbers instead of understanding them.
Instead of attempting to track numerous KPIs, prioritize a select few that are directly aligned with your objectives. These should be the KPIs that have the most impact on your organization’s success.
PRO TIP: Did you know that companies that hit over 75% of their goals in 2021 tracked more than five metrics? Finding the right balance between useful information and being overwhelmed with too much data is what allows the most successful companies to stand out.
Revise KPIs on a Quarterly Basis
Your organization’s priorities and strategies may shift over time. Regular KPI revisions allow you to realign your performance metrics with these evolving priorities.
What’s more, they enable your organization to be more agile and responsive to market change.
According to our research, most businesses change or add to KPIs at least quarterly.
But what if something relevant is happening with your KPI right now? You should wait several months until you find out?
This could lead to a lot of missed opportunities down the road.
Instead, why not use Databox’s alert tool to get these insights when they matter the most?
With alerts, you and your team are notified immediately when your performance is off, and something needs to be optimized strategy-wise.
You can create an alert for any type of data source and set up the exact variable that will trigger the notification (e.g., performance is down/performance is up).
PRO TIP: How Well Are Your Marketing KPIs Performing?
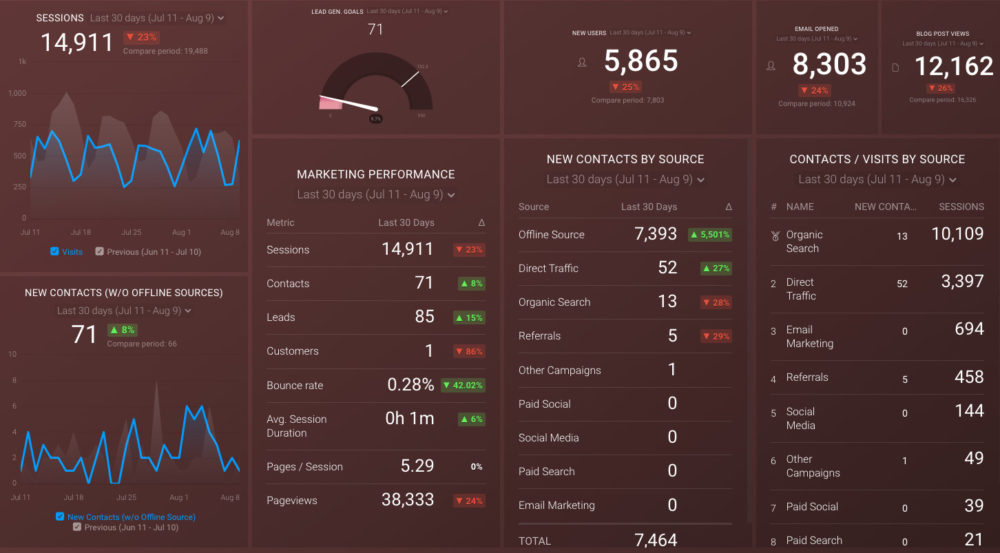
Like most marketers and marketing managers, you want to know how your efforts are translating into results each month. How is your website performing? How well are you converting traffic into leads and customers? Which marketing channels are performing best? How does organic search compare to paid campaigns and to previous months? You might have to scramble to put all of this together in a single report, but now you can have it all at your fingertips in a single Databox dashboard.
Our Monthly Marketing Performance Dashboard includes data from Google Analytics 4 and HubSpot Marketing with key performance metrics like:
- Website sessions, new users, and new leads. Basic engagement data from your website. How much traffic? How many new visitors? How many lead conversions?
- Lead generation vs goal. Did you reach your goal for lead conversion for the month, quarter, or year? If not, by how much did you miss?
- Overall marketing performance. A summary list of the main KPIs for your website: sessions, contacts, leads, customers, bounce rate, avg. session duration, pages/session, and pageviews.
- Email response. Overall, how effective were your email campaigns, measured by email opens?
- Blog post traffic. How much traffic did your blog attract during a certain period?
- New contacts by source. Which sources drove the highest number of new contacts
- Visits and contacts by source. How did your sources compare by both sessions and new contacts in a certain period of time?
Now you can benefit from the experience of our Google Analytics and HubSpot Marketing experts, who have put together a plug-and-play Databox template that contains all the essential metrics for monitoring and analyzing your website traffic and its sources, lead generation, and more. It’s simple to implement and start using as a standalone dashboard or in marketing reports!
You can easily set it up in just a few clicks – no coding required.
To set up the dashboard, follow these 3 simple steps:
Step 1: Get the template
Step 2: Connect your HubSpot and Google Analytics 4 accounts with Databox.
Step 3: Watch your dashboard populate in seconds.
KPI Examples
Next, let’s check out some real KPI examples for different departments that you’re likely to run into.
- Finance KPI Examples
- Sales KPI Examples
- Marketing KPI Examples
- Customer Service KPI Examples
- Operational KPI Examples
Finance KPI Examples
In the finance department, KPIs play a critical role in monitoring the financial health of an organization and ensuring fiscal responsibility.
Here, a good finance KPI would be: “reduce operating expenses by 10% in the next quarter”.
This KPI is specific and measurable. It defines the goal of reducing operating expenses by a precise amount (10%) and sets a clear time frame (the next quarter) for achieving this reduction.
A bad one would be something like “improve financial performance” because it’s too vague and doesn’t provide clear direction.
It doesn’t specify what aspects of financial performance need improvement or how the improvement will be measured.
To hit your KPIs, you’ll need to define which metrics you’ll track and analyze to make sure you’re on top of your performance.
Here’s one example of how you can track your financial performance metrics in Databox with our Financial Performance Overview Dashboard.

You can track all key financial metrics like pipeline revenue, revenue to goal, expenses, closed lost amount, and more – all in one place.
Sales KPI Examples
Sales KPIs are essential for evaluating the effectiveness of sales strategies and driving revenue growth.
Let’s start with an example of a bad Sales KPI: “increase sales revenue.”
This KPI is too general – there’s no clear information about which aspect of sales needs to be optimized.
A good sales KPI would be something along the lines of: “boost monthly sales conversion rate from 20% to 25% by the end of the quarter”.
This one defines a clear objective of increasing the monthly sales conversion rate from 20% to 25% within a specific time frame.
What’s more, the team can take targeted actions to achieve the goal, such as optimizing the sales process or training the sales reps to improve conversion rates.
In the Sales Overview Dashboard below, you can check out what it would be like to have a visual snapshot of your sales team’s monthly performance.

Here, we’re tracking new contacts, new deals, closed-won amount, the average time to close, and similar sales metrics (but you can add whichever ones you need to focus on).
Marketing KPI Examples
Marketing KPIs are crucial for gauging the success of your campaigns and coming up with new ideas for future strategies.
A good marketing KPI example would be to “Increase Instagram followers from 10,000 to 20,000 within six months”.
It’s specific, measurable, and it’s time-bound. The marketing team can use it to come up with targeted strategies to make the goal happen.
A bad Marketing KPI: “Get more likes and followers on social media.”
This KPI is vague and doesn’t specify the social media platforms, the exact number of likes and followers desired, or the time frame. It lacks clear direction.
Here’s one HubSpot Marketing Dashboard example where we can monitor some key marketing metrics such as sessions, new visitors, average session duration, new contacts, blog views, and more.

Customer Service KPI Examples
In the customer service department, KPIs are essential for measuring customer satisfaction and the efficiency of support operations.
What would be a bad customer service KPI? For example, “improve customer satisfaction”.
This KPI doesn’t define which aspects of customer satisfaction need improvement or how the team should track of it. Customer satisfaction is a multifaceted concept and it can encompass various factors like response times, issue resolution, or overall experience.
On the other hand, a good KPI would be to “reduce average response time to customer inquiries from 24 hours to 6 hours in the next quarter”.
If you want to track your customer service KPIs in one comprehensive place, here’s a Customer Success Overview Dashboard that you can download.

You can customize it according to your specific needs and follow key customer success metrics like new customers, customers helped, churned MRR, refunds, and more.
Operational KPI Examples
Businesses typically use operational KPIs to monitor the efficiency of their day-to-day processes.
One example of a good operational KPI is “reduce manufacturing defects from 5% to 1% in the next six months”.
It’s clear, and you’re setting a specific goal of what needs to be done and in what time frame.
A bad Operational KPI would be “enhance operational efficiency”.
This KPI is too general. Operational efficiency can include a wide range of factors, such as cost reduction, cycle time, resource utilization, or error reduction.
Below, you’ll see an example of how a team can track its operational KPIs in one place with real-time data.

Hours tracked, billable amount, uninvoiced amount, team overview… these are just some of the operational metrics you can keep an eye on with the Time Report Dashboard.
KPI Best Practices
With so many unwritten rules about proper KPI tracking and development, how to know which ones to focus on?
These best practices should help:
- Choose KPIs that are Directly Related to Your Goals
- Tracking Less Is More
- Ensure the KPIs Selected Meet the Criteria for a Good KPI
- Assign Each KPI to a Specific Team or Individual for Accountability
- Monitor and Report on Your KPIs on a Weekly Basis
Choose KPIs that are Directly Related to Your Goals
Start by establishing clear, specific goals for your organization. These could be revenue targets, market share objectives, or customer satisfaction goals.
Then, identify the critical factors that will help you achieve those goals. These could include metrics related to sales, marketing, customer service, or operational efficiency.
From that point, it comes down to regularly monitoring the KPIs and the most relevant metrics that help you stay on track.
If your goals evolve or priorities change, revisit the KPI and see how you can adjust it.
PRO TIP: Make sure you also have a healthy balance of qualitative and quantitative KPIs. While quantitative KPIs are numeric and easy to measure, qualitative KPIs can often provide more detailed insights. For example, customer satisfaction surveys or employee engagement scores can complement financial metrics.
Tracking Less Is More
When it comes to KPI monitoring, the saying “less is more” applies.
While it’s probably tempting to measure everything, it’s essential to understand that tracking too many KPIs can dilute focus. In reality, it’s much more effective to track a concise set of highly relevant KPIs.
This streamlined approach not only simplifies data analysis but also enables quicker, more informed decision-making later on.
Focusing on a smaller set of KPIs also makes it easier to identify cause-and-effect relationships, allowing you to pinpoint areas that require improvement.
PRO TIP: A good number to start with is between 5 and 8 KPIs. This is the sweet spot where you’re getting enough valuable information to understand the bigger picture, and you’re not risking any data overload. In general, anything over ten is considered too much and can bring confusion to the analysis.
Ensure the KPIs Selected Meet the Criteria for a Good KPI
Do your KPIs meet the criteria for being valuable?
First, a good KPI should provide a clear, quantifiable value that indicates performance.
Next, KPIs should be actionable. They should offer insights that can guide decision-making. Without actionable KPIs, you’re merely collecting data without a purpose.
And lastly, KPIs should be time-bound.
They should have a defined timeframe for measurement, whether it’s daily, weekly, monthly, or quarterly.
PRO TIP: If you’re frequently setting new KPIs for different departments, it would be a good idea to create a checklist of what qualifies as a valuable KPI. It helps speed up the pre-analysis process and helps other departments better understand your organization’s criteria.
Assign Each KPI to a Specific Team or Individual for Accountability
Assigning each KPI to a specific team is one of the best ways to ensure responsibility, ownership, and a greater likelihood of them achieving the set objectives.
When KPIs have clear owners, it becomes evident who is responsible for driving improvements.
Furthermore, when an issue arises related to a particular KPI, the responsible party can take the necessary actions to address it promptly.
Just don’t forget to make sure that those responsible actually have the necessary resources and support to meet their KPI targets.
PRO TIP: Regularly reach out to your team to see if they need help better understand the KPIs and if they have all the required resources to achieve them. If possible, creating mini-educations in the form of video lessons or PDF guides on what they have to do can also go a long way.
Monitor and Report on Your KPIs on a Weekly Basis
Regular monitoring and reporting are essential for staying on top of your organization’s progress and making timely adjustments.
While the frequency of KPI tracking can vary, a weekly cadence is often recommended.
Weekly monitoring allows you to identify trends and emerging issues quickly, which then enables your team to take proactive measures to address them.
But this practice isn’t set in stone – some companies can track their KPIs on a monthly or quarterly basis, without sacrificing results.
PRO TIP: Consider using a balanced scorecard approach, which involves tracking KPIs across multiple perspectives such as financial, customer, internal processes, and learning/growth. This provides a holistic view of performance and helps ensure that improvements in one area do not come at the expense of another.
Streamline KPI Monitoring and Reporting with Databox
Say you developed the right KPIs, created a list of your most relevant metrics that you’ll need to track, and made sure that these indicators meet the overall objective of your business.
All of these efforts could go to waste if you don’t have a proper tracking and analysis strategy.
And let’s face it, tracking performance data nowadays is anything but simple, especially if you’re doing things manually.
But you don’t have to do it manually… not when you have Databox by your side.
With Databox, businesses can compile all of their most relevant metrics and KPIs in one place, where they can track their performance data as it changes in real-time.
You won’t believe how easy it is to create Databox Dashboards – all you have to do is connect your data source, add the metrics you want to track, and then create professional visuals to make the numbers more understandable.
This makes both tracking and analysis so much easier… but what reporting?
Well, you can put that on autopilot as well with Databox Reports. No more spending countless hours polishing your reports so you can impress managers and stakeholders, that’s taken care of for you.
And as if all of this isn’t enough, there’s one more advantage to leveraging Databox – Benchmark Groups.
This tool helps you make sure your strategies are on point by providing you with real-time competitor data that you can benchmark your performance against.
Instead of doing it with unreliable and too general industry reports, now you can do it with similar-sized businesses in your exact niche.
So… if you’re looking to harness the full power of KPIs and squeeze every last bit of value from them, sign up for a free trial with Databox and let us help.


