


Table of contents
You stare at last quarter’s sales data in your spreadsheets, but when your CEO asks “What should we do differently next month?” you freeze.
The numbers are there, but they don’t tell a story. They don’t point to clear actions. Despite all the data you collect, you still make the most important decisions based on gut feeling.
Sounds familiar? You’re not alone.
Most businesses today gather mountains of data, but few turn it into real insights that lead to better decisions. The gap between having information and knowing what to do with it remains surprisingly wide.
That’s where good analytics software helps – not as another complex tool to manage but as the bridge between raw numbers and practical business strategy.
In this article, we won’t assume you already know how to turn numbers into decisions or burden you with technical jargon.
Instead, we’ll explain why analytics software truly matters for your business and help you choose solutions that deliver real value, not just prettier charts.

What Does Analytics Software Actually Do?
Analytics software collects, processes, and displays data in ways that help you make better business decisions.
Unlike basic spreadsheets, good analytics tools connect to multiple data sources, perform web analytics in real time, and show information through visual dashboards. They spot patterns humans might miss and help predict future outcomes based on historical data.
The best analytics software answers specific business questions like “Which products drive the most profit?” or “Where do my website visitors drop off?”
You don’t need to become a data expert to use these tools effectively.
According to a statistic from TechJury, businesses that use data analytics make decisions 5x faster than those that don’t. This speed advantage alone explains why analytics software has moved from a nice-to-have to a must-have tool for companies of all sizes.
Key Benefits of Analytics Software
A report from Forbes found that 79% of enterprise executives believe failing to adopt big data puts businesses at risk of losing their competitive edge—or worse, becoming obsolete.
This stark reality explains why analytics software has become essential for modern businesses. Here’s how it can help yours:
- Makes decisions faster and more accurate: Instead of guessing or relying on outdated information, you base choices on real-time data. This speeds up your response to market changes and reduces costly mistakes.
- Spots problems before they become critical: Good analytics tools detect unusual patterns and alert you to issues like dropping sales, increasing costs, or customer service problems while they’re still fixable.
- Eliminates data silos: Scattered reports from different tools slow down decision-making. Analytics software centralizes data from multiple sources, which gives you a complete, organized view of business performance.
- Optimizes resource allocation: Stop wasting money on strategies that don’t work. Analytics shows exactly which marketing campaigns, products, or services generate the best returns, so you can invest accordingly.
- Predicts future outcomes: Advanced analytics tools forecast trends based on historical data, helping you prepare for seasonal changes, shifting market conditions, and evolving customer preferences.
How Analytics Software Enhances Decision-Making
The ecom giant Amazon is an excellent example of how smart use of analytics software can transform decision-making that the average analyst could never crunch in time by hand.
The company processes vast amounts of data—customer purchase history, browsing behavior, and real-time inventory levels—to optimize its supply chain and improve the shopping experience.
By using predictive analytics, Amazon can stay ahead of sudden changes in demand, which reduces extra inventory and lowers freight costs.
The same software powers Amazon’s recommendation system, suggesting relevant products—like phone cases after a phone purchase—to increase sales.
Analytics software helps Amazon act fast. It updates inventory in real time to prevent shortages or overstock. AI-driven marketing tailors shopping experiences for every customer.
Instead of guessing, Amazon makes quick, informed decisions that cut costs, improve efficiency, and keep customers happy.
Top Features to Look for in Modern Analytics Platforms
The best analytics software doesn’t just collect data—it transforms it into actionable insights that drive real business results. Here are the must-have features to look for:
1. Robust Data Integration
Analytics software must pull data from multiple sources, including CRMs, advertising platforms, databases, and financial systems. The best tools offer:
- Native integrations with platforms like Google Analytics, Salesforce, HubSpot, and AWS.
- API access and custom connectors for pulling in data from niche or proprietary systems.
- ETL (Extract, Transform, Load) capabilities to clean, standardize, and consolidate data for analysis.
2. Real-Time Data Processing
Delayed data can lead to missed opportunities. A top-tier analytics tool should provide:
- Live data streaming for real-time insights into sales, customer behavior, and marketing performance.
- Automated alerts and anomaly detection to notify teams of critical changes, such as revenue dips or traffic spikes.
- Scalability to process large datasets instantly without slowdowns.
3. Advanced Data Visualization
Clear, intuitive reporting is key to making data-driven decisions. Look for:
- Customizable dashboards tailored to different teams (executives, marketers, product managers, etc.).
- Drill-down capabilities that let users explore data beyond high-level summaries.
- Interactive charts and graphs that make complex datasets easy to understand.
4. AI-Powered Predictive Analytics
Predictive insights separate basic analytics from truly valuable software, pulling techniques straight from data science and machine learning. Top platforms should include:
- Forecasting models to predict customer behavior, sales trends, and revenue growth.
- Churn prediction tools that identify at-risk customers before they leave.
- Prescriptive analytics that suggest actions based on data trends, not just show historical patterns.
5. Advanced Attribution and Performance Tracking
Knowing what drives success is essential for marketing and sales teams. Look for:
- Multi-touch attribution models that assign value to each touchpoint in a customer’s journey.
- Conversion funnel analysis to identify weak points and improve conversion rates.
- Customer journey mapping to see how different interactions lead to sales and retention.
Best Analytics Software Tool Compared
Most analytics software promise to supercharge your decision-making, but only a few actually deliver results that matter.
Below, look at the best web analytics tools and broader business-intelligence platforms used by top-tier companies:
1. Databox
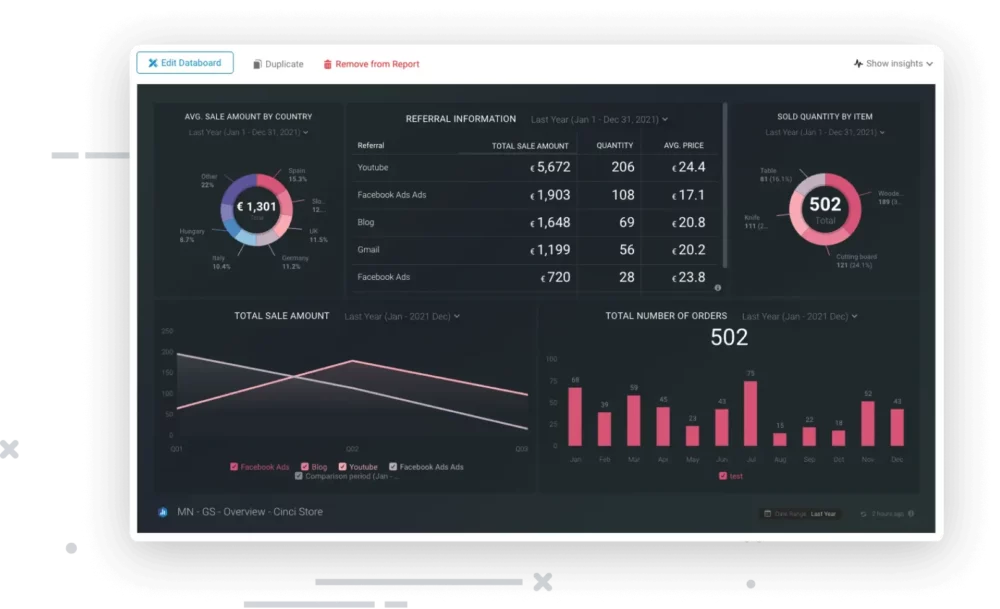
Databox is a business analytics platform that turns scattered data into a single, streamlined dashboard. It can improve your performance tracking, set goals, and automate reporting without jumping between multiple tools.
With real-time alerts, deep integrations across 130+ platforms, and fully customizable dashboards, Databox puts the most important insights front and center—no spreadsheets or manual data pulls required.
Key features of Databox
- Bring all your data into one place: With 130+ integrations, Databox pulls live data from tools like Google Analytics, HubSpot, Facebook Ads, and Salesforce. No more jumping between platforms—everything you need is in one real-time dashboard.
- Set goals and track progress automatically: Define clear performance targets based on past data, and let Databox handle the tracking. Real-time updates show whether you’re on pace, while instant alerts warn you if things start slipping.
- Build dashboards your way: Databox gives you full control over your reports with an easy drag-and-drop editor. Start with a pre-made template or build from scratch, adding widgets and charts that highlight the numbers that matter most.
- Automate reporting and save hours: Forget manual data pulls. Databox generates and delivers reports on a set schedule, so teams and clients always have the latest insights without extra effort.
- Start fast with ready-made templates: Need a quick setup? Choose from a library of pre-built dashboards designed for website analytics, PPC campaigns, social media tracking, and email marketing performance.
- Stay connected from anywhere: The Databox mobile app keeps you in the loop, letting you check dashboards, monitor KPIs, and receive alerts on the go. Perfect for executives and marketers who need real-time updates no matter where they are.
Pros of Databox
- New advanced analytics and data prep tools: In April 2025, Databox added powerful data preparation tools that make it easier to clean, organize, and analyze data.
- Easy-to-use platform with seamless integrations: Databox keeps things simple with an intuitive dashboard and connects to over 130+ data sources without any complex technical setup.
- Fast and hassle-free setup: Unlike many analytics tools that require complex configuration, you can connect data sources and start tracking metrics within minutes.
Cons of Databox
- Some features are a bit harder to master: While the platform is user-friendly, certain advanced features, like custom metrics and complex data blending, take time to master.
2. Tableau
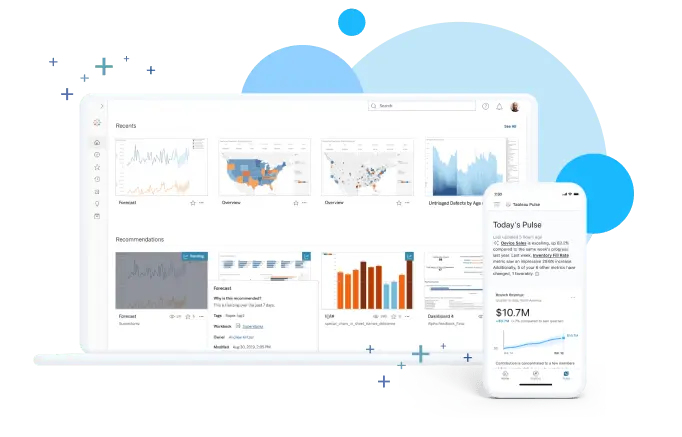
Tableau is a powerful data tool that lets you turn raw numbers into clear visual stories. With it, you can easily mix data from different places in real-time without any knowledge on complex database languages.
Key features of Tableau
- Connects to various data sources: Tableau pulls data from spreadsheets, databases, and cloud services, including Google Analytics, AWS, and Salesforce, so everything is in one place.
- Processes data in real time: It updates reports as new data comes in, so your team can track trends, spot anomalies, and adjust strategies instantly.
- Maps geographic data: The software visualizes location-based insights with advanced mapping tools, including heatmaps, custom territories, and geospatial analysis.
- Blends multiple data sources: It combines structured and unstructured data from different platforms, even if they don’t have a shared key, making cross-platform analysis easier.
- Works on mobile devices: Dashboards automatically adjust to different screen sizes, and the mobile app allows users to interact with reports on the go.
Pros of Tableau
- Strong data visualization: Tableau creates interactive charts, graphs, and maps that make complex data easier to understand and explore.
- Handles large datasets well: It processes millions of data points quickly, so users can analyze big datasets without delays.
- Works with many data sources: It connects to spreadsheets, databases, cloud platforms, and APIs, making it easy to bring different types of data into one place.
Cons of Tableau
- Takes time to learn advanced features: Basic reports are easy to create, but more complex tasks like calculations and data blending require extra training.
- Expensive for businesses with many users: The cost adds up quickly for teams that need multiple licenses or advanced tools like Tableau Prep.
- Limited real-time collaboration: Unlike some other analytics tools, Tableau doesn’t let multiple users edit dashboards at the same time.
Tableau pricing
Tableau offers three main subscription plans based on user roles:
- Creator: Costs $75 per user per month (billed annually) and includes Tableau Desktop, Tableau Prep Builder, and one Creator license on Tableau Cloud or Tableau Server.
- Explorer: Costs $42 per user per month (billed annually) and allows users to access and analyze data, create dashboards, and manage content. It includes one Explorer license on Tableau Cloud or Tableau Server.
- Viewer: Costs $15 per user per month (billed annually) and is for users who only need to view and interact with dashboards and visualizations. It includes one Viewer license on Tableau Cloud or Tableau Server.
Tableau customer reviews
- G2: 4.4/5 (2,200+ reviews) [See G2 Reviews]
- Capterra: 4.6/5 (2,300+ reviews) [See Capterra Reviews]
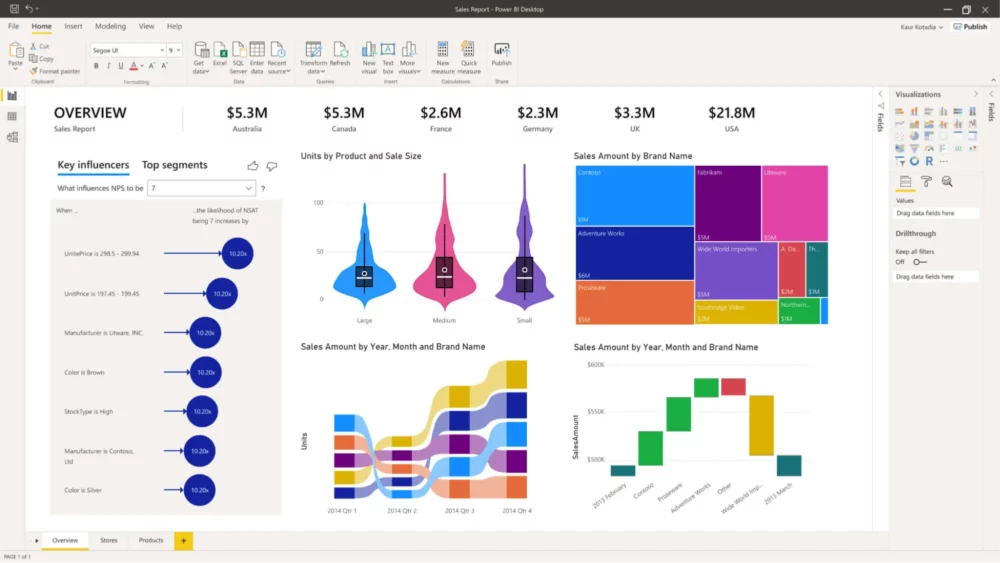
3. Microsoft Power BI
Power BI is a business analytics tool by Microsoft that helps you transform complex data into clear, interactive visualizations. It lets you connect to hundreds of data sources and share insights across your organization with secure, user-friendly dashboards.
Key features of Power BI
- Works with many data sources: It connects to Excel, SQL databases, cloud storage, and other business apps.
- AI-powered insights: Built-in AI helps spot trends, predict outcomes, and analyze customer feedback.
- Simple data cleaning: Power Query allows users to organize and prepare messy data before analysis.
- Microsoft integration: Works seamlessly with tools like Excel, Teams, and Azure for easy collaboration.
- Strong security: Role-based permissions and encryption keep business data safe.
Pros of Power BI
- Beginner-friendly interface: Drag-and-drop tools make it easy to create reports, even for non-technical users.
- Affordable pricing: The Pro plan costs less than many other analytics tools while offering strong features.
- Constant improvements: Microsoft regularly updates Power BI, adding new features and improving performance.
Cons of Power BI
- Takes time to master advanced features: Creating simple reports is easy, but complex data analysis requires learning DAX and SQL.
- Slows down with big datasets: Power BI can struggle with very large amounts of data unless properly optimized.
- Less customization than competitors: While powerful, it has fewer advanced design options than tools like Tableau.
Power BI pricing
Microsoft offers two pricing tiers:
- Power BI Pro: $10 per user per month.
- Power BI Premium Per User (PPU): $20 per user per month.
Power BI customer reviews
- G2: 4.5/5 (1,200+ reviews) [See G2 Reviews]
- Capterra: 4.6/5 (1,700+ reviews) [See Capterra Reviews]
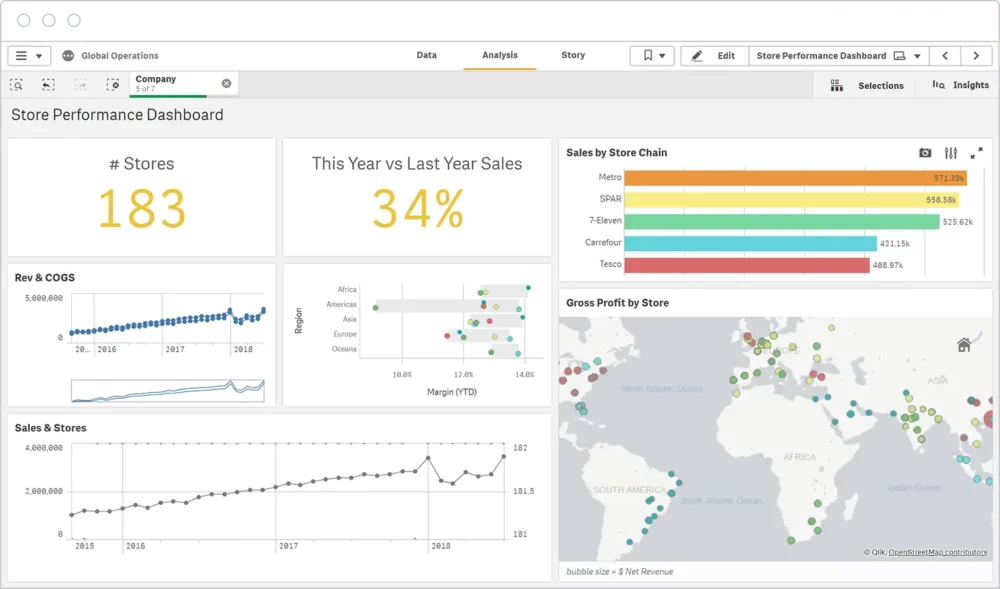
4. Qlik
Qlik is a data analytics platform that uses a unique associative engine to help you see hidden connections in your data. It lets you explore information freely without pre-built paths, so you can reveal insights that traditional tools might miss.
Key features of Qlik Sense
- Associative data engine: Qlik Sense lets users explore data freely, showing connections that might not be obvious in traditional tools.
- Smart visualizations: The platform provides interactive charts, graphs, and maps that adjust as users explore data.
- AI-powered insights: Built-in machine learning helps detect patterns, suggest insights, and automate data analysis.
- Data storytelling: Users can create presentations that combine analytics with explanations, images, and interactive charts.
- Embedded analytics: Businesses can add Qlik Sense analytics into their own apps, improving data access for users.
- Strong security: Includes access controls, encryption, and compliance with security standards to protect your business data.
Pros of Qlik
- Finds deeper insights: Qlik’s Associative Engine helps users uncover patterns and relationships in data that other tools might miss.
- Flexible deployment options: Businesses can use Qlik Sense in the cloud, on their own servers, or both.
Cons of Qlik
- Takes time to learn advanced features: Basic reports are easy to create, but more complex data modeling requires training.
- Extra costs for advanced tools: Some features, like extra data connectors and AI-powered tools, cost more.
- May slow down with very large datasets.: Some users experience slow performance when handling massive datasets.
Qlik pricing
Qlik Sense offers three pricing tiers:
- Standard: Starts at $825 per month, including 25 GB of data and 20 full users, with additional storage and users available for purchase.
- Premium: Costs $2,500 per month, increasing storage to 50 GB and supporting up to 100,000 basic users, along with additional features like predictive analytics and enterprise data governance.
- Enterprise: Custom pricing based on higher storage needs (500 GB+), enterprise scalability, and volume discounts.
Qlik customer reviews
- Capterra: 4.4/5 (900+ reviews) [See G2 Reviews]
- Capterra: 4.5/5 (200+ reviews) [See Capterra Reviews]
5. KNIME
KNIME is an open-source data analytics platform that uses visual workflows to transform how analysts work with data. You can use it to create complex data pipelines by connecting blocks together without any coding.
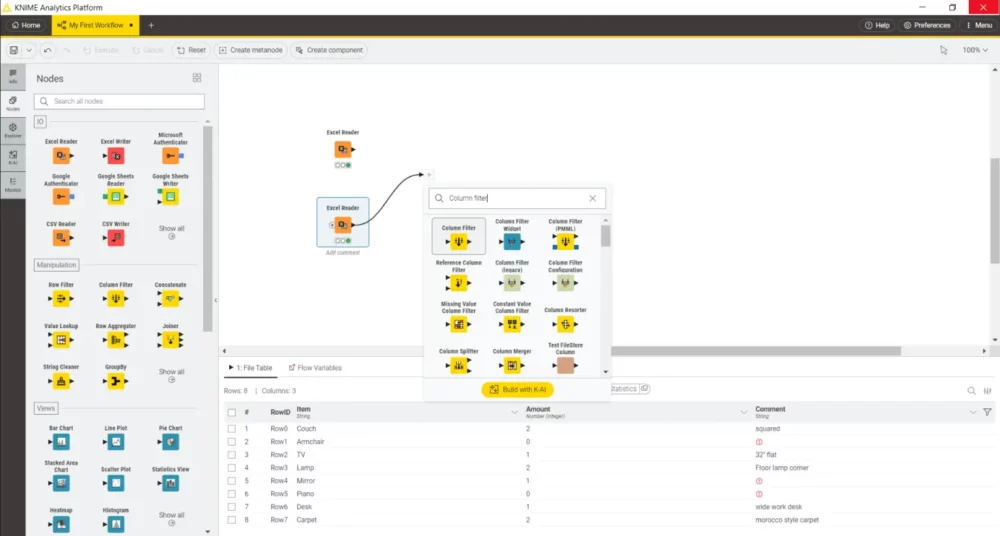
Key features of KNIME
- Drag-and-drop workflow builder: Users create data workflows visually by connecting blocks, which makes complex data work easier without coding.
- Connects to 300+ data sources: Links directly to databases, cloud platforms, spreadsheets, and big data systems for easy data access.
- Advanced analytics tools: Includes built-in machine learning models, predictions, and statistics for deeper insights.
- Modular design: Adds new features with plugins for text mining, image processing, and forecasting so businesses can customize KNIME to their needs.
- Works with Python, R, and Java: Lets users add custom scripts and extend functions for special needs.
Pros of KNIME
- Free and open-source: You get a full access to KNIME without any licensing fees.
- Easy for beginners: Users reported that KNIME’s interface is user friendly.
Cons of KNIME
- Needs strong hardware for big datasets: Performance slows down with massive data unless properly optimized.
- Limited visualization tools: Charts and graphs get the job done, but they don’t match the interactive visuals of Tableau or Databox.
KNIME pricing
KNIME Analytics Platform is free. Businesses can upgrade for extra features:
- Community Hub Team Plan: €99 per month for three users with private workflow sharing.
- Business Hub Basic: $35,000 per year with dedicated workflow hosting and automation.
- Business Hub Standard: $62,500 per year for up to three teams, with advanced management and security tools.
- Business Hub Enterprise: Custom pricing for organizations that need more features.
KNIME customer reviews
- G2: 4.4/5 (60+ reviews) [See G2 Reviews]
- Capterra: 4.6/5 (25+ reviews) [See Capterra Reviews]
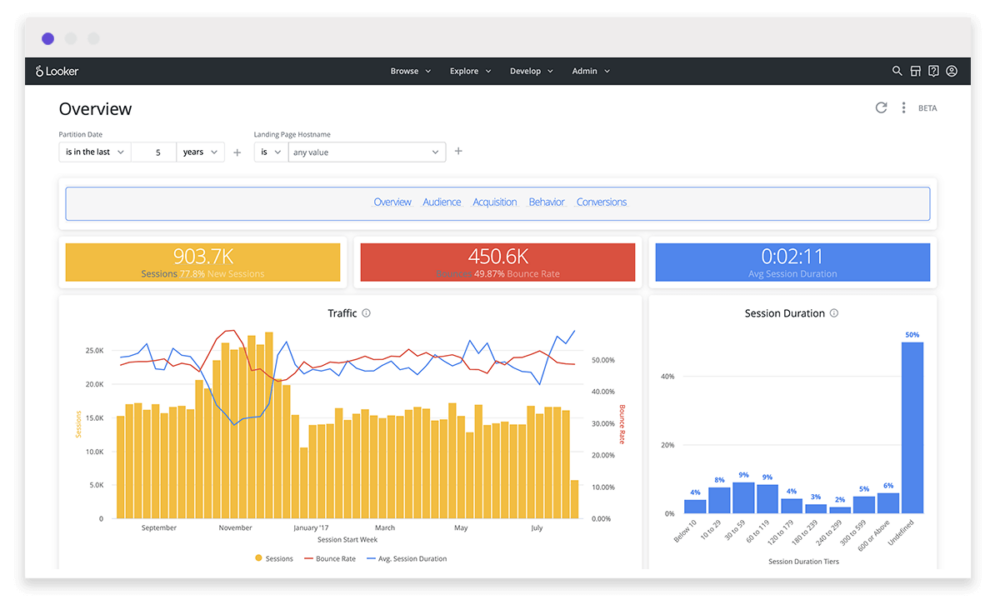
6. Looker
Looker is a business intelligence platform that pulls live data from multiple sources and turns it into interactive reports.
Its LookML modeling language defines business metrics in one place, so every team works with consistent, real-time data without relying on static dashboards or outdated exports.
Key features of Looker
- Custom data modeling with LookML: Looker uses LookML to define business metrics in one place to make sure that data is consistent and accurate across all reports.
- Real-time data exploration: Users pull live data directly from databases without relying on static exports or outdated reports.
- Embedded analytics: Businesses add Looker’s reports to websites and apps so teams and customers can see key insights without switching platforms.
- Easy data sharing: Teams can send reports, set alerts, and work with the same real-time data in one platform.
- API access for custom use: Developers connect Looker to other tools, automate reports, and customize dashboards.
Pros of Looker
- Live data without exports or duplicates: Looker connects directly to databases, so users always work with up-to-date data instead of dealing with stale reports or manual exports.
- Highly customizable data models: LookML lets teams define business metrics once, so reports stay accurate and consistent across the organization.
- Strong integration with Google Cloud and third-party tools: Looker works seamlessly with Google BigQuery, Snowflake, and other cloud data warehouses.
Cons of Looker
- Slow performance on complex queries: Some users experience lag when running large or complex queries, especially when Looker processes high-volume datasets.
- Steep learning curve for new users: Unlike drag-and-drop BI tools, Looker requires users to understand LookML and database queries, which takes time to learn.
- Limited visualization options: Looker provides strong analytics but lacks the deep customization and variety of chart types found in tools like Tableau or Power BI.
Looker pricing
Looker doesn’t share their pricing publicly – you’ll need to reach out to their sales team for a quote. What you’ll pay depends on your company size, how complex your data is, and which features you need.
Looker customer reviews
- G2: 4.4/5 (1,400+ reviews) [See G2 Reviews]
- Capterra: 4.6/5 (200+ reviews) [See Capterra Reviews]
7. Sisense
Sisense is a cloud analytics platform that processes massive datasets directly in CPU cache memory, which lets regular users instantly analyze billions of records through an intuitive drag-and-drop interface.
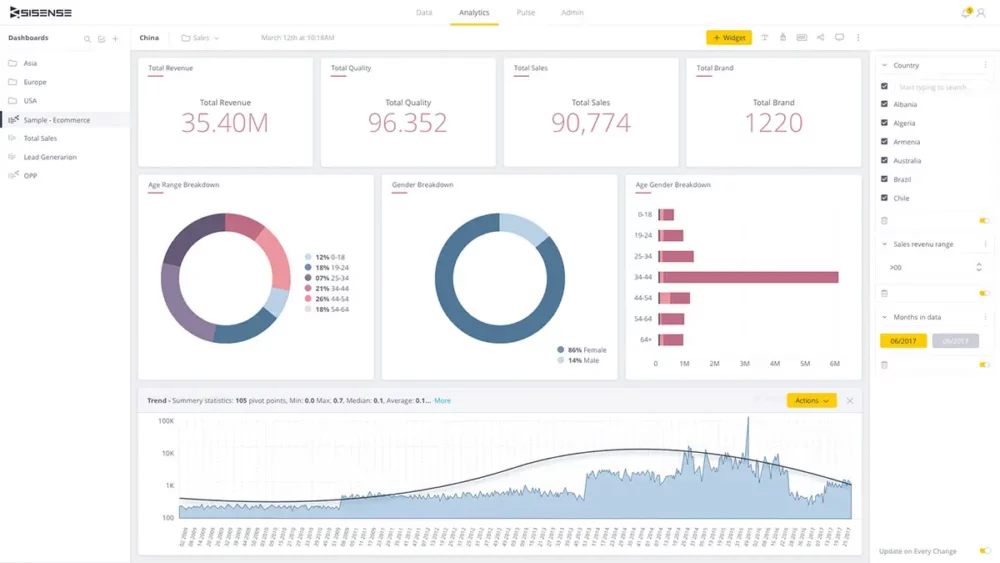
Key features of Sisense
- In-Chip® processing: Sisense crunches billions of rows of data directly in CPU cache memory, which makes complex analytics lightning-fast even with massive datasets.
- Code-free data modeling: Business users can join multiple data sources and create relationships without SQL knowledge using simple drag-and-drop functionality.
- White-label embedding: You can easily embed dashboards into your products with customizable branding to deliver analytics to your customers.
- Natural language queries: Ask questions in plain English and get instant visual answers without needing to build queries or reports first.
- API-first architecture: Developers can extend and customize the platform with open APIs that integrate analytics into your existing workflows.
Pros of Sisense
- Powerful embedded analytics for custom applications: Sisense allows businesses to embed analytics directly into their own apps and software.
- AI-driven analytics with natural language queries: Sisense’s AI Assistant lets users ask questions in plain language and receive instant insights.
Cons of Sisense
- Performance issues with large datasets: Some users report slowdowns when handling extremely large data volumes.
- Steeper learning curve for advanced features: While basic dashboards are easy to create, advanced functionalities like Looker Blocks and custom scripting require more technical expertise.
- Limited out-of-the-box visualization options: Sisense offers strong customization, but its default chart and graph selection is less extensive than competitors.
Sisense customer reviews
- G2: 4.2/5 (1,000+ reviews) [See G2 Reviews]
- Capterra: 4.6/5 (200+ reviews) [See Capterra Reviews]
How to Choose the Right Analytics Tools for Your Business (Without Wasting Time or Money)
1. Start by Asking the Right Questions (Not the Ones Vendors Want You to Ask)
When shopping for analytics software, most businesses fall into the trap of comparing feature lists. Instead, focus on your specific needs. The comparisons of the top tools included in the guides above will save hours of guesswork.
Ask yourself what single decision your team needs to make faster. For instance, if inventory management is your biggest challenge, you’ll want software with robust supply chain analytics that provides real-time insights.
Consider who will actually use this tool day in and day out. The needs of C-suite executives looking for high-level performance dashboards differ dramatically from those of a data analyst who needs to build custom models. Understanding your primary users will narrow your options considerably.
2. Ignore Feature Lists—Focus on These 3 Technical Realities
Feature lists won’t tell you the whole story.
Start with data compatibility—if your data lives in Google BigQuery but the tool specializes in SQL Server, you’ll waste months on integration. Ensure any solution connects easily with your existing systems and offers flexibility for custom data sources.
Performance matters at your actual scale, not the vendor’s carefully curated demo. Test potential solutions with your real data volumes to avoid unpleasant surprises when you go live.
A tool that can’t handle your data volume will ultimately fail, regardless of its features.
Lastly, consider your team’s capabilities honestly.
Even sophisticated AI-powered analytics are worthless if your team struggles to use them effectively. Sometimes a simpler tool that gets used consistently delivers far more value than an advanced solution gathering digital dust.
3. The Hidden Costs That Sink ROI
The sticker price only scratches the surface of an analytics software.
Consider training requirements first—even “user-friendly” platforms typically demand 20+ hours per employee. This lost productivity should factor into your ROI calculations.
Then, there’s data preparation to consider. Some tools work only with pristine data, adding weeks of cleaning work before you see any value. Others handle messy inputs more gracefully, saving valuable time during implementation.
Many organizations overlook the risk of vendor lock-in until it’s too late.
If exporting your data and workflows becomes difficult, you’re essentially held hostage to future price increases.
Always ask vendors directly: “How easily can we switch if needed?” Their answer will speak volumes about their confidence and business practices.
4. Try Before You Buy (The Right Way)
Make your trial period meaningful by testing with real scenarios. Skip the polished demo dashboards and instead load your actual data to recreate reports you rely on, like your monthly P&L.
While you’re at it, test the support team too. Submit a help request during your trial—their response often foreshadows your future experience better than any sales pitch.
Finally, watch how your team interacts with the new tool. If they’re sneaking back to Excel during the trial, you’ve already uncovered a problem. The best analytics solution is ultimately the one your team will truly use.
Final Words – Why Investing in Analytics Software is Essential
Businesses are drowning in data—but most of it goes unused.
Reports sit in spreadsheets, numbers pile up, and decision-making slows down. Without the right tools, data becomes noise instead of insight.
That’s why analytics software is no longer optional. Companies that use analytics don’t just see what happened—they spot trends, identify risks, and predict what’s coming next. They move faster, adjust strategies in real time, and make decisions based on facts, not gut feelings.
But not all analytics tools make this process easy. Some require complex setups, manual reporting, or technical expertise that slows teams down.
Databox eliminates those roadblocks. With seamless integrations, real-time tracking, and automated reports, it puts businesses in control of their data, not the other way around.


