


Table of contents
In most companies, internal reporting looks exactly like this:
- Executives determine what’s important for various levels of management to see.
- They pump out the information to recipients on a regular basis.
The end.
As the business grows and new data sources and metrics are added to the mix, internal reporting becomes more complex and burdensome.
Over time, companies may not even feel so confident that they are tracking the right KPIs.
They have little visibility into how their reports are actually used – but most of them do believe that at least half of their team knows how to read them.
The value of internal reporting lies in bringing insights to the business and creating effective stories about what information might mean to different audiences. So, how has reporting changed in the last 12 months? What will internal reporting look like in the future? Are companies only report builders or insight generators?
Databox sought to explore exactly this.
As we surveyed 300+ companies globally on their internal reporting processes and requirements, we gained a better understanding of what benefits they experienced, the struggles they faced (or are still facing), and best practices any company can follow to improve their reporting process.
Continue reading the full report or skip to our beautiful infographic on standard and advanced reporting practices.
Who Did We Survey?
During July, August, and September 2022, we surveyed 314 companies on a global level; 241 of the responses we received were eligible for analysis.
Out of those 241 companies, 38.6% are marketing agencies (digital or media), 32.4% provide B2B services or products, 19.9% are B2C companies, and 9.1% have a mix of B2B and B2C business models.
The majority of respondents to our survey hold C-Level roles (over 60%). Other respondents were mostly in executive positions — Director, Manager or SVP/VP. Only 7.05% of our survey participants are individual contributors.

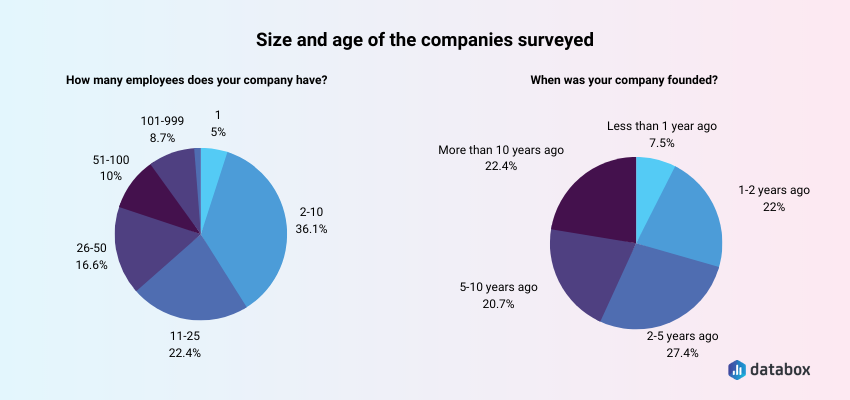
Most respondents have under 25 employees, with less than 20% exceeding the 50-employee mark, making this research and conclusions of particular interest to small and mid-sized companies.
The majority of companies we talked to were founded five years ago or more recently.
When it comes to the surveyed companies’ financial size, most of our respondents said that their businesses made up to $1,000,000 during the last 12 months. Only 5% said they made over $10,000,000.
The amount they were paid by the clients varies a lot, but it shows a fairly even distribution across all price segments.

We have conducted this research to have a better understanding of the current state of business reporting — from analyzing companies’ internal reporting requirements and processes to understanding the benefits of regular performance reporting for their business and identifying common best practices.
Many of the respondents also answered open-ended questions about their experiences. While we couldn’t include everyone’s insights, you’ll notice we included many insights in the report below.
We’d like to deeply thank our respondents for their cooperation and insight. This report couldn’t have been made without you.
Apart from our respondents, this report couldn’t have been completed without the diligence and hard work from Tamara Omerović (Content Marketing Manager), Špela Mlekuž (Content Marketing Coordinator), and Davor Štefanović (Copywriter).
Executive Summary
Companies are well-aware that internal reporting is incredibly important. This is especially true now, during economic instability and business upheavals. While companies claim to base their decisions and strategies on data and have experienced significant benefits due to regular monitoring and reporting, many still struggle with data when making business decisions.
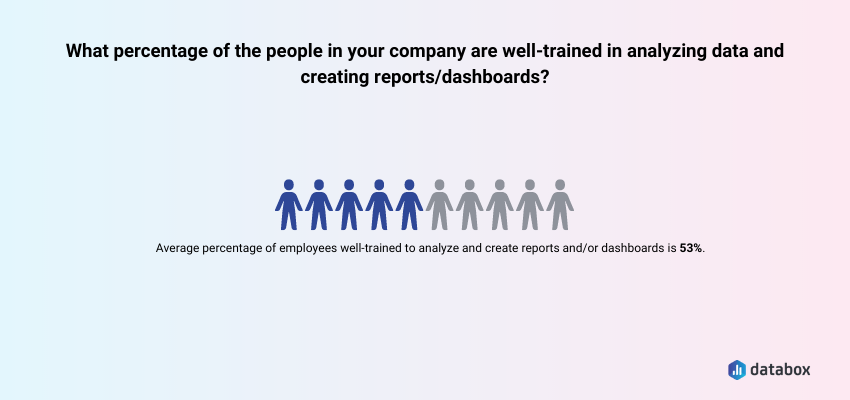
Most companies rely on their own resources for making reports — they do it in-house, and in most cases, reports are made by Managers, Directors, and/or VPs. This means that (in most companies) the management is able to read and interpret data. Our respondents estimate that around 53% of their employees are trained to analyze data and create reports/dashboards, which is more than we expected.
A significant minority of the surveyed companies, 45%, make their reports accessible to all employees, while about 55% make their reports accessible only to the management. In another recent (and related) research about the value of business transparency in reporting, companies showed that they are well aware that business transparency (encouraged by internal reporting) is very important for teams. It allows teams to understand their strengths and weaknesses, plan better, deal with issues openly and increase loyalty.
However, to utilize the reports in the company, the employees must be able to understand them. Even if our respondents were right in estimating the percentage of their data-literate employees, half of them would still struggle with report interpretation.
About half of the companies are sure they are monitoring the right KPIs. The rest of them are not so confident — or not confident at all.
Findings
Here’s what we discovered during our research:
- More than half of the companies are not sure they are tracking the right KPIs
- The biggest share of companies select KPIs based on their experience
- Most businesses change or add to KPIs at least quarterly
- Almost half of the companies set their goals for 1 to 5 metrics
- Most companies revise their goals quarterly
- Most companies met or exceeded more than half of their goals for the last year
- Marketing, sales and finance are the most monitored and reported operation for performance
- Sales, Marketing and Customer Success performance are the most frequently reported operations
- Managers and upper management are responsible for making reports
- Companies mostly make reports in-house
- Our respondents believe that about half of their employees are data-proficient
- Most companies make their reports accessible to managers and above
- Most companies primarily present their reports in meetings
- Most companies have meetings to discuss their reports
- Most companies produce 5 reports per month or more
- Most companies spend 3 hours or more making reports
- Making reports requires 4 different activities
- Companies rely on a broad range of tools when making reports
- Over 40% of companies use more than 10 tools for monitoring or reporting
- The number of data sources used for tracking and reporting is growing
- Most companies have very standardized reports
- Companies mostly include 1–2 years of historical data in their reports
- Most companies include outcome, quality, and output metrics in their reports
- Most companies include comparisons to previous periods and progress toward goals in their reports
- Companies use multiple report formats
- Reporting and monitoring improve performance
- Regular monitoring and reporting bring concrete benefits
1. More than half of the companies are not sure they are tracking the right KPIs
Almost half of our respondents (49.38%) are very confident in their KPIs, and 46.5% are somewhat confident.

With less than 5% of respondents not being confident they’re tracking the right KPIs, it’s clear that the vast majority of companies at least somewhat trust their metrics and rely on them to make business decisions.
PRO TIP: SMART goals have been adopted as a universal framework that helps individual businesses choose the right KPIs. Any KPIs you settle on should be chosen with the acronyms Specific, Measurable, Attainable, Relevant, and Time-Bound in mind. If you really want to travel down the rabbit hole of measurable values, you can go from SMART to SMARTER. That means adding “Explainable” and “Relative” to the above system. Learn more here.
2. The biggest share of companies select KPIs based on their experience
In fact, almost half of the companies we polled said they choose their KPIs according to their previous experience.
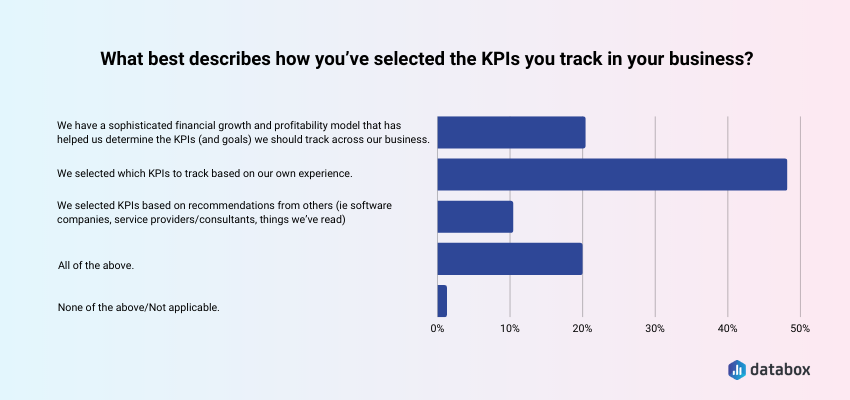
Personal experience leads the way and is considered the most trusted barometer for the largest share of companies. Only 20.33% reported that they have a financial model that has helped them determine the KPIs (and goals) to track across their business, while almost 20% said they rely on multiple inputs (a mix of a financial model, their own experience, and recommendations from others) in order to choose their KPIs.
David Wain-Heapy of Prodigi emphasizes the importance of picking the right KPIs, as identifying them can be a struggle. However, things definitely change when the company manages to focus on what it should be tracking. “Once we shifted the KPIs to be more integral to the core roles rather than feeling like additional work for the team, they were easier to achieve and measure,” Wain-Heapy says.
PRO TIP: Many times, the most important KPIs come from taking a step back. Think about the outcomes you are looking for and then take a step back and look at the behaviors that lead up to those outcomes. Tracking those behaviors add up to accomplishing strategic initiatives. Read more about best practices for developing KPIs that are aligned with your business goals and strategic priorities here.
3. Most businesses change or add to KPIs at least quarterly
The largest percentage (over 45%) of surveyed companies stated they change or add KPIs they’re tracking quarterly.
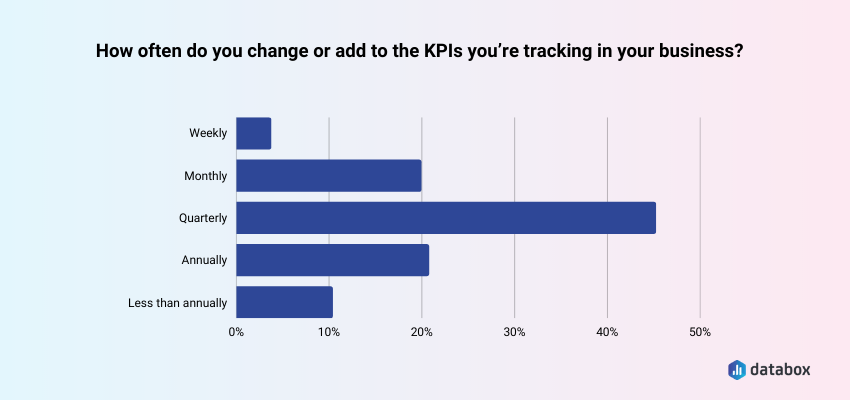
Roughly 20% change them once per month, and less than 5% adjust them weekly.
Modifying KPIs is a part of the process. Sometimes you need trial and error to find the right ones, and it can be tricky to do so.
Alex Cascio of Vibrant Media Productions says the initial struggle at the company was finding the right KPIs to monitor. As the company is new to implementing KPIs, finding the best ways to implement them was also a challenge.
“A proper and robust KPI dashboard that’s easy to understand, such as Databox has helped our team better process the information with actionable insights. Setting up a KPI plan has helped us with overall sales, marketing, and internal organization as a whole,” Cascio concludes.
PRO TIP: KPI tracking shouldn’t require logging into dozens of different tools to get a simple update. In Databox, you can automate performance alerts for any metric and set the conditions for when that alert should be sent. Want to know when your sales opportunities decrease by a certain percentage? Or if your sales goal is unlikely to be hit based on current trends? Set the entire system in just a few clicks.
4. Almost half of the companies set their goals for 1 to 5 metrics
The largest share of respondents said they set goals for 1–5 metrics, with just under 40% saying they use 6–10 metrics for that purpose.
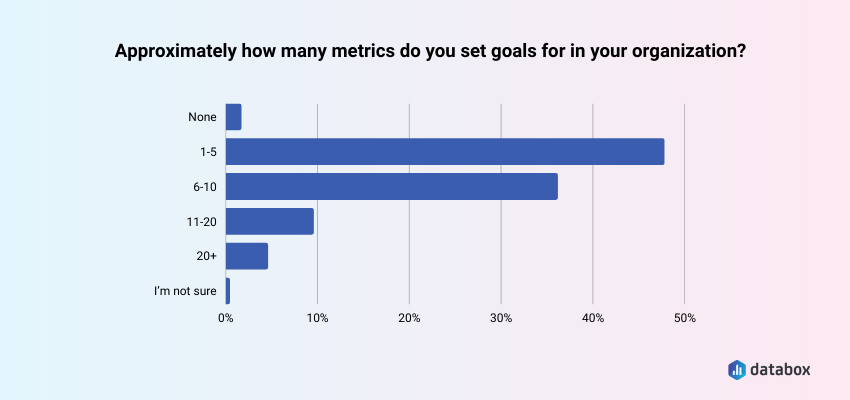
Having a variety of metrics is undoubtedly a good thing, with over 80% of the companies we surveyed setting goals using 1–10 metrics. As the number of metrics increases, the number of companies using them decreases. Tracking a large number of metrics at the same time requires greater finesse, as it’s easy to end up overwhelmed by too many data points.
PRO TIP: The first step toward telling an effective story with data is making sure everyone who cares about performance agrees on which metrics are needed to measure it. To get started, organize your metrics into two categories – output metrics (your activities) and outcome metrics (impact of your outputs). If you want to create an environment where you and your team are *always* in control of the company’s performance, sign up for our free business analytics training course and learn:
- How to align your team around the right metrics and goals
- Analyze performance as it happens
- Adjust plans based on performance insights
- Predict future performance across your whole company
5. Most companies revise their goals quarterly
Over 60% of companies revise goals quarterly based on last quarter’s performance and other factors.
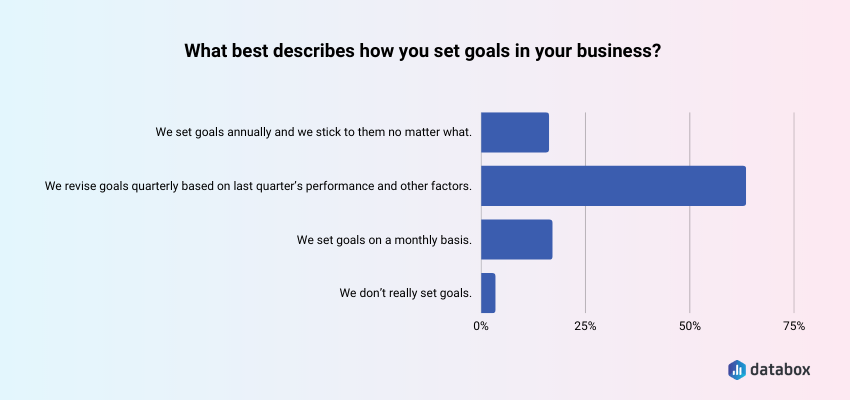
This approach allows for both flexibility in goal selection and modification, and a reasonable time span to determine how the company is performing with respect to those goals. Tracking goals over too short of a period can make you vulnerable to short-term trends, while revising them too rarely means you may be locked into tracking them even as circumstances in the market change.
PRO TIP: High-level goals aren’t always actionable for teams and individuals. But, if you set monthly goals in Databox, our tool will automatically calculate the associated weekly and daily goals, too. This way, your team (and every individual) will have a measurable way to track performance and progress on a daily, weekly, or monthly basis. The same can be done for annual and quarterly goals. Need to adjust goals for a specific period? No problem — we got you covered.
6. Most companies met or exceeded more than half of their goals for the last year
More than 40% met or exceeded 51–75% of their goals, while 30% met or exceeded over 75% of their goals set in the last 12 months.

A significant percentage of our respondents achieved or exceeded at least some of their goals for the last year. Less than 5% achieved a quarter of them or less, meaning most are doing at least something right.
Instantly and Anonymously Benchmark Your Company’s Performance Against Others Just Like You
If you ever asked yourself:
- How does our marketing stack up against our competitors?
- Are our salespeople as productive as reps from similar companies?
- Are our profit margins as high as our peers?
Databox Benchmark Groups can finally help you answer these questions and discover how your company measures up against similar companies based on your KPIs.
When you join Benchmark Groups, you will:
- Get instant, up-to-date data on how your company stacks up against similar companies based on the metrics most important to you. Explore benchmarks for dozens of metrics, built on anonymized data from thousands of companies and get a full 360° view of your company’s KPIs across sales, marketing, finance, and more.
- Understand where your business excels and where you may be falling behind so you can shift to what will make the biggest impact. Leverage industry insights to set more effective, competitive business strategies. Explore where exactly you have room for growth within your business based on objective market data.
- Keep your clients happy by using data to back up your expertise. Show your clients where you’re helping them overperform against similar companies. Use the data to show prospects where they really are… and the potential of where they could be.
- Get a valuable asset for improving yearly and quarterly planning. Get valuable insights into areas that need more work. Gain more context for strategic planning.
The best part?
- Benchmark Groups are free to access.
- The data is 100% anonymized. No other company will be able to see your performance, and you won’t be able to see the performance of individual companies either.
When it comes to showing you how your performance compares to others, here is what it might look like for the metric Average Session Duration:

And here is an example of an open group you could join:

And this is just a fraction of what you’ll get. With Databox Benchmarks, you will need only one spot to see how all of your teams stack up — marketing, sales, customer service, product development, finance, and more.
- Choose criteria so that the Benchmark is calculated using only companies like yours
- Narrow the benchmark sample using criteria that describe your company
- Display benchmarks right on your Databox dashboards
Sounds like something you want to try out? Join a Databox Benchmark Group today!
7. Marketing, Sales and Finance are the most monitored and reported operations for performance
When it comes to monitoring and reporting for performance, Marketing, Sales, and Finance are in the clear lead, with the majority of our respondents saying they track and report on these operations on a regular basis.
Additionally, almost half of the surveyed companies regularly monitor and report on Client Success and Support.

In order to meet the standard, companies should monitor and report performance from at least these four departments.
PRO TIP: A centralized dashboard reporting tool, such as Databox, can help you track, analyze, and display key business metrics and KPIs in one place, providing you with an in-depth overview of your company data in real-time. Build a dashboard, present it live, then create an in-depth report—within the same tool. The all-hands-on-deck scramble to get custom dashboard reports built from screenshots, spreadsheets and duct tape can officially be considered a thing of the past.
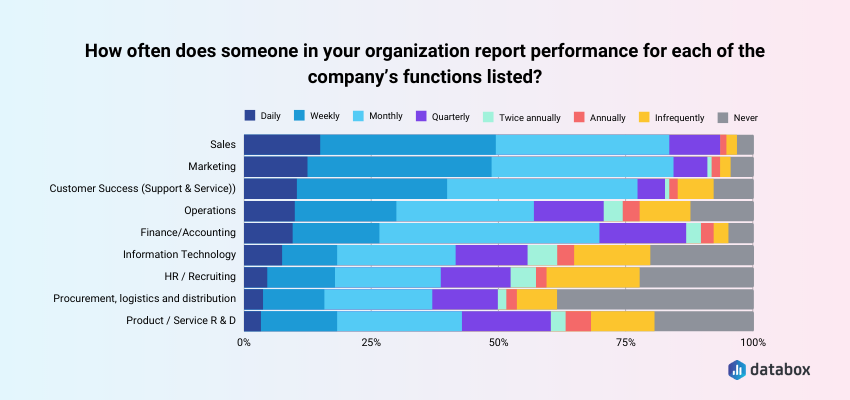
8. Sales, Marketing and Customer Sucess performance are the most frequently reported operations
Over 75% of our respondents said they report on Sales, Marketing, and Customer Success (both support and service) at least once a month.
Finance comes in fourth, which, when combined with the previous statistic, further emphasizes the importance of these four departments.
With the growing complexity of performance tracking and reporting, businesses have been taking deeper dives into their sales and marketing performance.
Bill Harrison of ComplianceBridge said that his company is doing it to identify and lessen the gaps between the two. “Part of this process involved implementing new technologies to support the connection of disparate data channels, which has greatly improved our ability to create accurate, useful reports,” Harrison concluded.
PRO TIP: You can’t turn data into information without a strong reporting process in place. And developing an effective reporting process start by displaying your data in a practical and useful way. We asked 59 companies to share their reporting approaches and best practices, including the mistakes they recommend avoiding.
9. Managers and upper management are responsible for making reports
A large majority of polled companies (over 85%) have management and above taking care of company reports.
In over half, managers, directors, and VPs are responsible for reporting their own teams’ performance, while executives and owners monitor and report on overall performance in just under 30%.
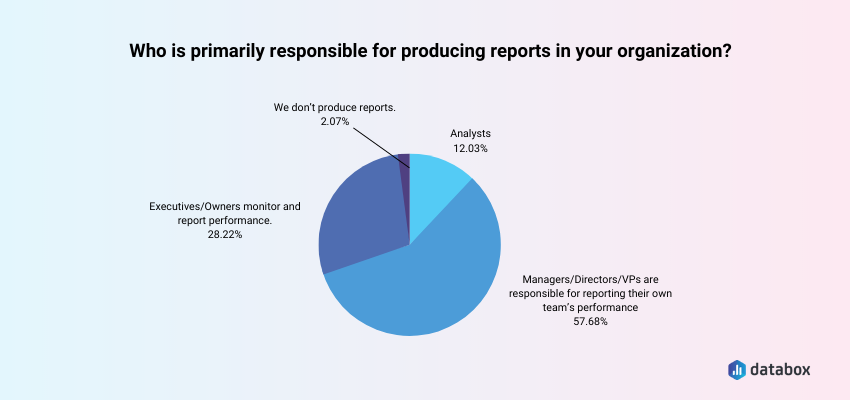
Only 12% of the surveyed companies said they give that job to analysts. It’s clear that a large percentage of companies still see reporting as a management job and with professional report automation tools, it doesn’t even have to take up too much time.
At Wise Barber, Viktor Holas says that the company has begun implementing targeted training for internal reporting. “We designed a training program that teaches our managers what to report on and what is expected with internal reports. Although we are not a large company, this has really been useful in streamlining the efficiency of our tracking and reporting system.”
PRO TIP: Whether you’re creating reports for your clients or simply looking to improve your internal reporting process, manual reporting can be complicated and time-consuming. Copying and pasting the data you need from different tools into your own presentation takes time and leaves room for errors. Learn how Databox can help you automate this process and not only save hours of work but also reduce reporting complexity and improve the quality and cadence of your reports.
10. Companies mostly make reports in-house
Companies overwhelmingly favor in-house reporting instead of outsourcing it to external consultants or service providers.
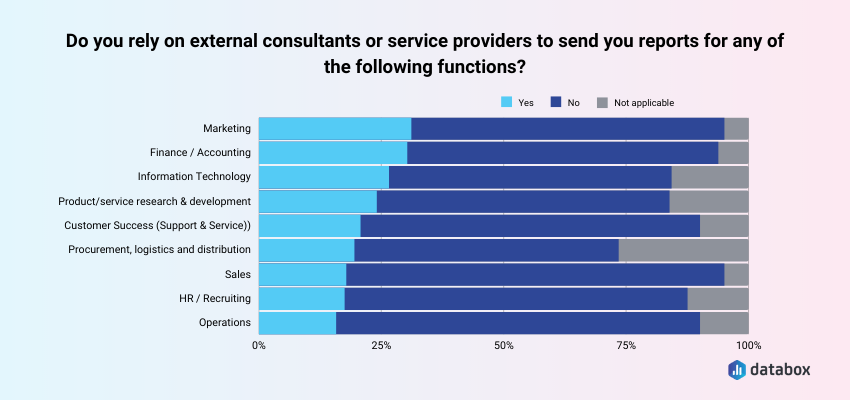
This dovetails neatly with the previous statistic. In-house staff, be they managers, executives or analysts, is seen as more reliable when it comes to reporting. Despite this tendency, around a third of our respondents said that they do rely on external sources to provide them with marketing reports.
With easier access to automated reporting tools and easy setup of report dashboards, an increasing number of companies feel more confident about taking care of this themselves.
According to Cayley Vos of Netpaths, dashboards give busy and non-technical people an easy way to see real numbers in business. “We have taken our dashboards to a different level and posted a large office-wide screen showing current goals and past successes. The shared screen dashboard has transformed the office into a happier place, with shared responsibilities and shared trust,” Vos explains.
PRO TIP: Need Help Building a Custom Dashboard?
Not sure which metrics to track or dashboards to build? Have old reports you want to recreate in Databox? Share your dashboard needs with one of Databox’s product experts and we’ll build you a customized dashboard for free.
Here is an example of what your dashboard can look like… (just imagine your data populating here)

And here’s another one…

We get it. You may not have the time to build out the perfect dashboard before your next meeting.
Luckily, we do.
Connect with someone on our team, share the metrics or areas that you need to track, and we’ll build your dashboards for you in just 24 hours.
Learn more about our free dashboard setup here, reach out for assistance via email or chat, or book a call.
11. Our respondents believe that about half of their employees are data-proficient
Most of our respondents clearly believe that more than half of their employees are data proficient. This explains the previous points where most prefer to keep the reporting in-house and rely on the management and above to handle it.
After all, they know the business best and what they should focus on. With some help from reporting tools, they can craft compelling and easy-to-understand data stories that will make sense even to the staff that’s not data proficient.
PRO TIP: Data literate or data proficient employees are better at asking the right questions in pursuit of goals, collecting and connecting the right data points to their question, determining whether or not a certain piece of information is reliable, and much more. We asked 65 companies to share their proven tactics for growing data literacy skills among their team(s).
12. Most companies make their reports accessible to managers and above
Out of 55% of companies that restrict report availability to managers and above, 17% only allow access to senior executives, owners, and board members, while 37% also give access to managers.
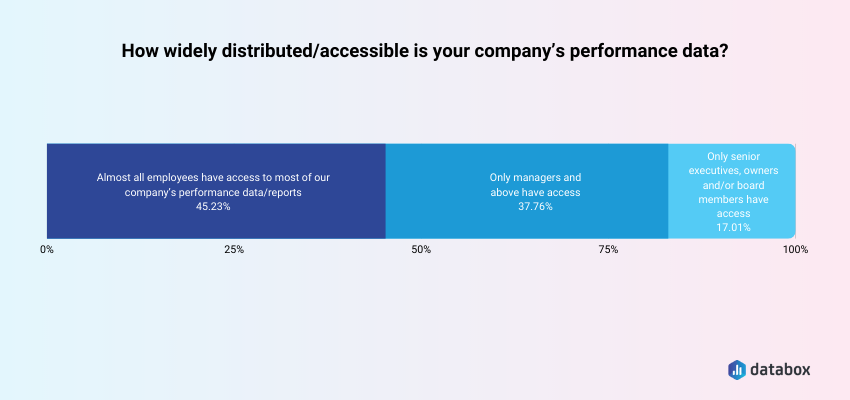
That leaves us with the 45% of respondents who give access to the company’s performance/data reports to almost every employee.
PRO TIP: Since managers and executives usually have a lot on their plates, checking up on frequent reports can take valuable time from the work of actually managing their departments. Scheduling report snapshots can alleviate a good part of that burden since they only need to be set up once and then provide regular one-click access to a snapshot of the current situation.
13. Most companies primarily present their reports in meetings
Over 56% of companies we interviewed share reports on meetings, be it online (via Zoom) or in person.

Of course, that’s not the only way the reports get shared, as over half of companies use both asynchronous sharing (email, Slack, etc.) and live dashboards. It’s safe to assume that a significant percentage of companies make use of at least two of these methods.
PRO TIP: How many times have you said, “this meeting should have been an email”? If you are tired of a reactive meeting structure and having frequent meetings that cover only surface-level topics, take a look at curated tips from 50+ companies on how to run more productive reporting meetings (for any cadence).
14. Most companies have meetings to discuss their reports
Continuing from the previous point, a significant majority of companies schedule meetings to discuss report results and next steps.
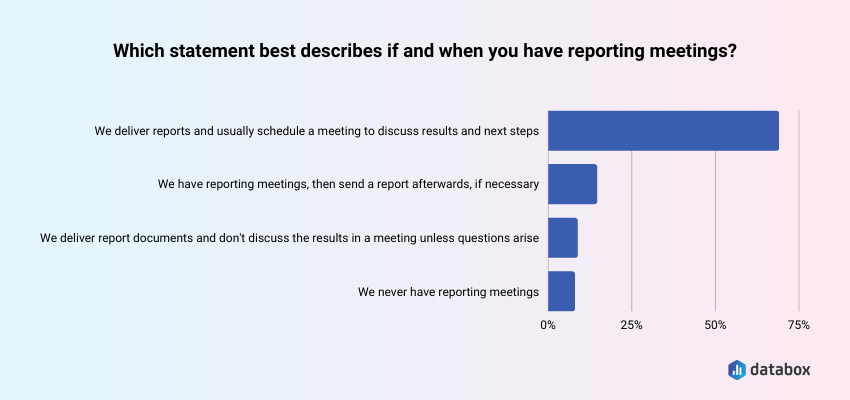
Meetings are still seen as an important part of the reporting process. Having a discussion about what the numbers mean and what should be done with the results is a necessary step that allows companies to plan their future goals with more certainty.
PRO TIP: Team meetings can either be an effective way to get everyone aligned and hitting their goals, or they can be a waste of time for everyone who attends. If you don’t want to be in the latter group, check out how 25 managers run effective weekly meetings that their team actually enjoys.
15. Most companies produce 5 reports per month or more
Over three-quarters of our respondents said they produce at least five reports every month.
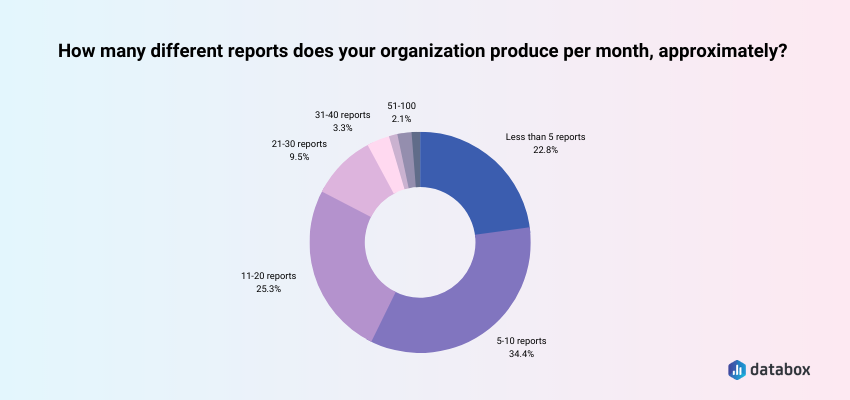
While the largest percentage said they make 5–10 reports, the other segments aren’t lagging behind; over a quarter said they produce 11–20 reports.
Jennifer Spinelli of Watson Buys mentioned that the increased report complexity presents a significant challenge, “We have had to invest more time and resources into our tracking and reporting processes. We have also had to make sure that our team is properly trained on how to use the various tools and systems that we have in place.”
There’s clearly a need for multiple reports per month, and with reports growing in complexity, there’s also a need to streamline the whole process.
“Databox has allowed me to better understand key performance indicators like conversion rates, profit margins, and customer engagement. What’s more, is that it visually organizes data in one place, allowing me to look at critical metrics at a glance. This has helped me see where we lack and develop targeted strategies to improve. I’ve observed that my employees are more productive now, and we can easily pinpoint and solve various problems. As a result, saving us a lot of time and energy.”

Want to get highlighted in our next report? Become a contributor now
PRO TIP: Read our comprehensive, step-by-step guide on how to create an effective business report and grab one (or a few) of the free report templates we’ve shared.
16. Most companies spend 3 hours or more making reports
More than 75% of companies we surveyed spend three hours or more making reports per month.

While that may not seem like much, there are quite a few companies that spend significantly more than three hours. Around half said they spend six hours or more each month making reports, and around a quarter spend 11+ hours. That is not an insignificant amount of time.
Fortunately, automated reporting with tools like Databox can shave off a significant chunk of time. Krittin Kalra of Writecream says that automated dashboards saved the company many hours. Just custom dashboards cut the reporting time in half. “Previously, a lot of our time was spent in compiling reports and then drawing conclusions. Now that the time for compiling reports is less, we are able to make decisions quickly and have also increased our reporting frequency,” Kalra explains.
PRO TIP: If you’d like to try automation or add more automated processes to your workflow, we consulted 16 agencies about their experiences and best practices. Learn what automated reporting can do for agencies and the 5 benefits they noticed.
17. Making reports requires 4 different activities
Most companies we polled identified four activities necessary for making reports.
Almost two-thirds of respondents said that modifying dashboards or running new analyses in a business intelligence tool is typically required for them to complete their reporting process.
Downloading or entering data into spreadsheets, running analyses in spreadsheets, and writing up (and/or discussing) conclusions and next steps are the next on the list.

Sergi Diaz of Keynote Speaker Agency said that reporting tools make it easy and fast for the company to digest all the information, make sense of it, and then decide how to pivot if necessary.
PRO TIP: Did you know you could create compelling reports without leaving Databox? Build a dashboard, present it live, then create an in-depth report—all in one place. Instead of spending hours swimming in spreadsheets, simply plug them into our spreadsheet reporting tools to immediately turn them into effective business insights. For added context, take a look at how simple it is to build a live dashboard from your Google Sheets data with our tool. Now imagine what you can build if you take a step further with Reports and Data Stories to add the business context that your data needs and turn numbers into a narrative.
18. Companies rely on a broad range of tools when making reports
Over 50% of companies reported they use nine different types of tools when making reports.

The most frequently used tools are, from most used to least used, SEO tools, Website Analytics, CRM/Sales tools, Social tools, Email Marketing, Marketing Automation, Project Management, Ad Platforms, and Accounting and Payment Processing tools.
These tools are more than nice-to-haves that help things along. In many cases, they are a necessity. Dinesh Agarwal of RecurPost calls dashboard tools a godsend as they free up the developers from having to pull reports. “We need not worry about what reports are needed and we can even pull reports that are helpful only once or twice. Before these tools, we had to brainstorm to decide on what reports are needed so that we did not give our developers unwanted work.”
PRO TIP: Managing data seems simple at first glance, but it gets tricky when you realize how many sources you have to manage. If you want the full picture of your company’s performance, you’ll need to look at data related to all aspects of your business, including operations, sales, and marketing, and more. And that’s where a good dashboard reporting tool comes in. We asked 78 data dashboard users about their reporting habits and their dashboard software of choice.
19. Over 40% of companies use more than 10 tools for monitoring or reporting performance
While most companies use less than 10 tools for monitoring and reporting performance, a significant number use more.
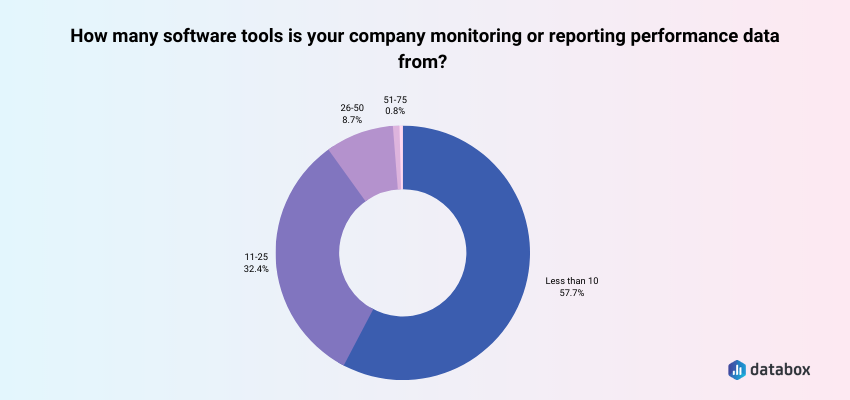
Almost a third of polled companies use between 11 and 25 tools for monitoring and reporting performance data, and 8.7% use between 26 and 50.
Using a large number of different tools for any task can be very complex. The added tools make the reporting itself more complicated and increase the likelihood of error. Fortunately, Databox itself can be used as a centralized reporting solution that can draw metrics from a variety of tools and data sources and combine them into clean, easy-to-understand reporting dashboards.
Vijay Roy of Applied AI Consulting tied the growing need for diverse tools to organizational growth. This can be an issue as it results in more disparate data and reports. “We are trying to get the unified report aligned with business goals. This is helping teams align with uber business goals and not just focus on their KRAs in silos.”
PRO TIP: Dashboard visualization tools allow you to quickly scan the data and see your progress on specific goals. Here’s our list of top choices.
20. The number of data sources used for tracking and reporting is growing
Over 60% of our respondents said that the number of data sources they use for reporting increased over the last 12 months.
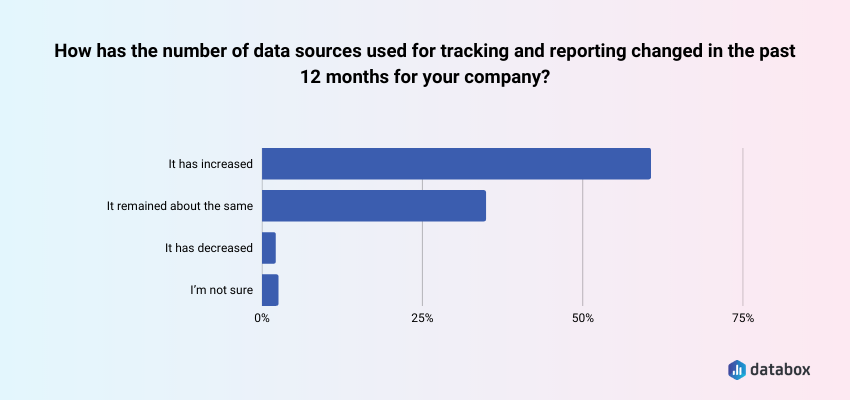
As with reporting tools from the previous statistic, the growing number of data sources makes reporting more challenging as they need to be analyzed and collated correctly. This corresponds to one of our open-end questions — when we asked companies how have their business performance tracking and reporting processes changed in the past 12 months, most respondents stated it has become more complex and demanding.
According to Jennifer Spinelli of Watson Buys, “In the past 12 months, our business performance tracking and reporting processes have become more complex and demanding. We have had to track and report on more data points, and we have had to do so in a more detailed and nuanced way. This has been driven by changes in our business, such as expanding into new markets and product lines, as well as changes in the competitive landscape.”
“The reporting process has become more complex and demanding because there are so many new things to report. Our website offers 40+ tools and we track analytics and user activity for each.
So, imagine tracking the user journey, session time, and conversion for each tool. It’s tough.
Over the last few months, we have also explored new marketing channels, like video ads, and have also scaled up our content creation efforts, so that has made the reports more complicated. To put it simply, as we have added more sources at the top of the funnel, our marketing funnel has become very complex which has made reporting hard.
But we are improving our reports continuously using automated analytics software and dashboards. Thanks to these software, we were able to cut our reporting time to half in the last quarter.”

Want to get highlighted in our next report? Become a contributor now
PRO TIP: Marketers are often forced to create performance dashboards from each app they use, then “staple” them together and try to make sense of their “report”. Why not identify the key metrics that tell your data story across all of the apps you use, and combine them in one comprehensive report? Here’s how you can create more informative, more insightful reporting dashboards from multiple data sources.
21. Most companies have very standardized reports
Almost 60% of companies we surveyed have reports that include the same KPIs and charts every time they are put together.

Around 30% of respondents said that they often add new charts and KPIs to the reports every time they put them together, and around 15% do so usually.
PRO TIP: When it comes to reporting, tools like Databox can help automate the whole process, especially if the changes to reports are minimal. Setting up a simple template allows people making reports to minimize the effort required while still being confident the data is correct and that everything fits together properly. For those who need to change charts and metrics from time to time, Databox templates are fully customizable and can be adjusted with just a few clicks.
Here is an example of one of our top-downloaded marketing templates. This template is 100% customizable, no matter whether you want to add or remove a few metrics, change the visualizations and dashboard colors, or even plug in another data source.

22. Companies mostly include 1–2 years of historical data in their reports
Almost half of our respondents said they include one to two years of historical data in their reports.
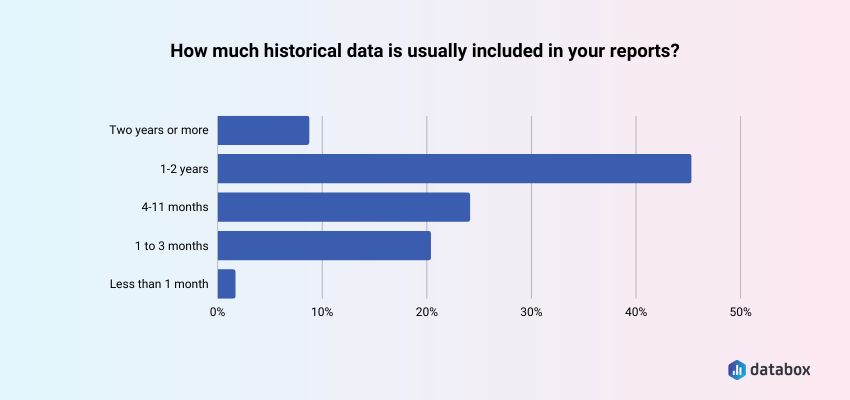
Most of the remaining respondents use less historical data, and a small minority of less than 10% include more.
Including historical data allows for a greater context of the metrics, KPIs and goals achieved, so it’s not surprising most companies include a decent range that allows for detailed progress comparisons.
PRO TIP: One of the most powerful ways to use historical data is for performance forecasting. Learn how Lone Fir Creative uses Databox to forecast, set and achieve agency and client goals.
23. Most companies include outcome, quality, and output metrics in their reports
Outcome metrics are by far the most popular, with almost 80% of our respondents including them.
Quality and output metrics follow at 68% and 64%, respectively.

Tracking output metrics makes sense as it’s the best way to see if the business is achieving its goals.
Erik Norsted of Olive & Company confirms that by saying that focusing on business outcomes as opposed to marketing metrics was the way forward for his company. “We still review the various components of marketing performance, so we understand how marketing is contributing to results, but the hierarchy of information has definitely changed.
We’ve also built out a measurement framework that provides detailed information about KPIs, goals, related metrics, historical benchmarks, and data sources. This framework helps us identify all of the components we want to include in our dashboards, and it reveals areas where there may be limitations with our available data.”
PRO TIP: No campaign, project, or department is ever going to achieve sustainable success without monitoring its performance and optimizing accordingly. To monitor progress effectively, you need KPI dashboards. We asked 15 companies to share dashboard examples that they create in order to monitor the performance of their businesses.
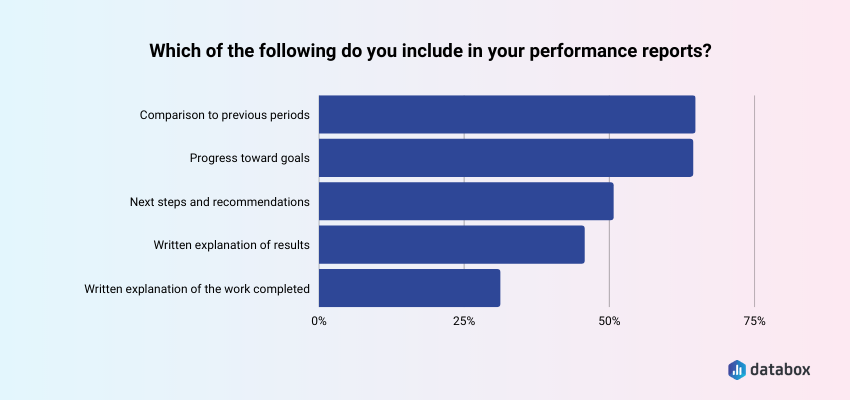
24. Most companies include comparisons to previous periods and progress toward goals in their reports
Almost 65% of companies include comparisons to previous periods in their reports.
A similar percentage (64.32%) include progress towards goals, and just over half (50.62%) include next steps and recommendations.
PRO TIP: Monthly business reports are one of the best ways to keep your internal stakeholders in the loop and make sure they are up to date with the latest company activities. A good monthly report includes progress toward goals, current tasks, next steps, recent accomplishments and other significant happenings that have occurred within the past month. They are used as a foundation for future decision-making and healthy business growth. To learn how to write your monthly business report quickly and efficiently, go through our step-by-step guide.
25. Companies use multiple report formats
The most popular report formats are spreadsheets, used by 64.32% of our respondents, followed by live dashboards, used by 59.75% of our respondents.

Word/Google Documents are solidly in the third place, being used by 56.02% of our respondents, and presentation slides are fourth, being used by just over 50%. Finally, around 40% of companies use PDFs to present reports.
PRO TIP: Databox lets us visualize the data from spreadsheets which makes it easier to get insights, share, and track over time. But in order to get the most from this option, you need to have properly formatted Google Sheets. From there, no matter whether you need to present live dashboards and written reports in meetings, or send PDFs and snapshots to relevant stakeholders, we got you covered.
26. Reporting and monitoring improve performance
An overwhelming majority of our respondents (90%) said that monitoring and reporting improved their performance at least to some degree.
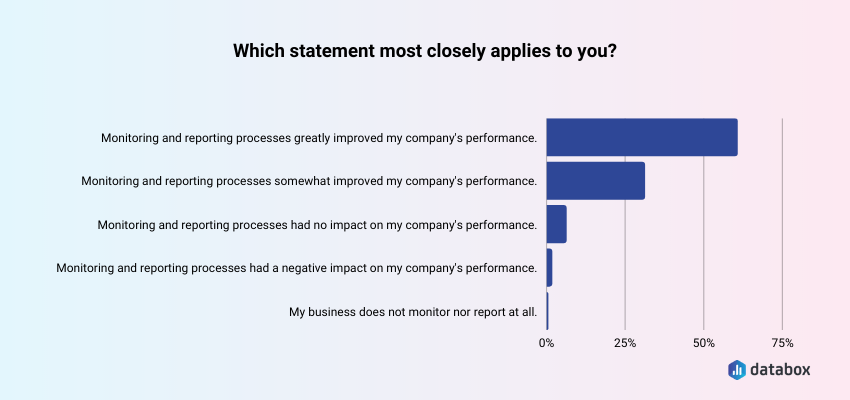
In fact, close to 60% stated that monitoring and reporting processes greatly improved the company’s performance.
As these practices allow for a more detailed analysis of performance, as well as course correction when things aren’t going as planned, these results are not surprising.
Scott Rubzin of Tiffany Property Investments credits Databox with increasing employee productivity. According to Rubzin, employees can now generate insights from existing information regarding the future of the market, allowing them to “streamline their sales pitches and marketing strategies effectively. As a result, they can make insightful decisions.”
PRO TIP: Performance reporting doesn’t only help you continually track your performance and productivity, but also devise effective strategies that will help sustain business growth. So think of performance reporting as a channel that can be used to build a strong communication network to collect and disseminate all of your business and market data, effectively communicate business progress, and forecast future progress. We talked to 57 experts to discover how monitoring performance impacted their business in these critical times.
27. Regular monitoring and reporting bring concrete benefits
Unsurprisingly, the largest percentage of companies reported that regular monitoring and reporting improved progress monitoring (80.06%).
The respondents also reported that it increased team effectiveness (65.15%), allowed them to identify trends more easily (62.66%), and improved financial performance (61.83%).
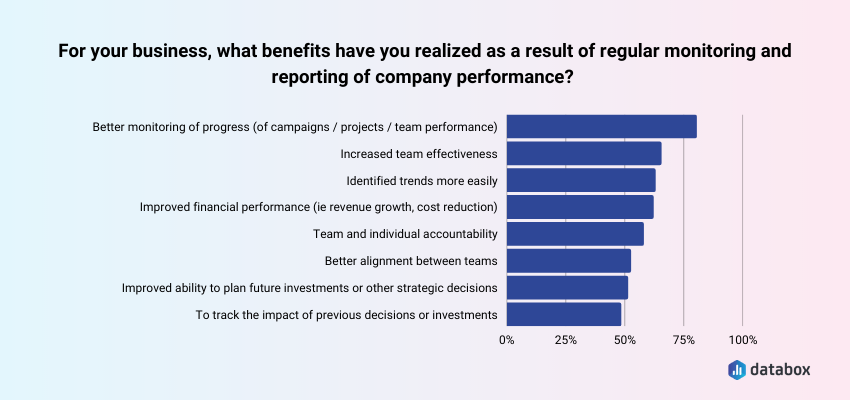
It doesn’t end there; with regular reporting comes improved team and individual accountability, better alignment between teams, and an improved ability to plan future investments and strategic decisions.
Of course, it’s important to focus on the right metrics and avoid the deluge of less relevant information. David Gu of Inyouths LED Mirrors warns of not distinguishing between strategic KPIs and other types of data and combining all of the KPIs into a single large report or dashboard. “It’s time-consuming for business leaders and decision-makers to sift among pages and pages of KPIs to find the most important ones. It is because of this that the most important information is lost in a sea of unnecessary data,” Gu concludes.
This is why it’s important to segment the data and reports themselves properly and only include the metrics that are really relevant.
Amy Wampler of Spartan Mechanical said that dashboard tools really helped with that issue. The tool organizes all important information and metrics in one place in a visually appealing way that’s easy to understand. “It’s easier for us to understand the metrics and see what areas we can improve in. The best part is that it has improved collaboration between teams.”
PRO TIP: We asked over 30 experts to share how they created effective, scalable performance reporting processes. These are the 8 best practices you should follow.
Best Practices from Companies That Hit the Majority of Their Goals in 2021
We identified 72 (about 1/3 of the total number) companies that reported hitting more than 75% of their goals in 2021. These proved to be mostly B2B companies and agencies — each representing 37.5% of the sample.

Most of them were founded more than five years ago and have more than 25 employees.

About 40% of them also reported revenue of over one million US dollars in the past 12 months, and they’re serving clients of varying sizes.

Here’s what we learned from them:
- They’re confident they’re tracking the right KPIs
- They choose KPIs based on a financial model and previous experience
- They set goals for more than 5 metrics
- They monitor and report on marketing, sales, finance, and customer success
- They most frequently report on sales, marketing, CS, finance, and operations
- They create complete reports
- They share their reports via live dashboards
1. Increased confidence in tracking the right KPIs
In fact, all of them are at least somewhat confident, and about 70% are very confident in the KPIs they’re monitoring.

Companies that reported hitting more than 75% of their goals in 2021 show a significantly greater degree of confidence that they’re tracking the right KPIs than the general sample.
2. About 30% of them have a financial model + previous experience
Around 30% of these companies choose KPIs based on their financial and profitability models, and just under 45% said they choose KPIs based on their previous experience.

A very small minority of 1.39% pick their KPIs based on recommendations from others.
This tells us that most successful companies mostly focus on their own research and trust their experience. They understand that there’s no one-size-fits-all solution and are willing to put in time and resources into figuring out what works best for their business.
3. The majority sets goals for more than 5 metrics
Almost two-thirds of the companies that reported hitting more than 75% of their goals in 2021 track more than five metrics, and the largest percentage of the total (44.5%) track between six and ten.

These companies appear to be tracking more metrics than the average but even they usually don’t track too many. Finding the right balance between useful information and being overwhelmed with too much data is what allows the most successful companies to stand out.
4. They regularly monitor and report on marketing, sales, finance, and customer success
Companies that reported hitting more than 75% of their goals in 2021 follow the same general trend as other companies, with most of them both monitoring and reporting on marketing, sales, finance, and customer success operations.

A significant portion of most successful companies also dedicate some resources to monitoring and reporting and reporting on Operations and R&D. Access to and capability to analyze these types of information helps companies really take in the big picture, allowing them to make better strategic decisions about their business.
5. Frequent reporting on sales, marketing, CS, finance, and operations
This follows the previous point. The majority of these companies report on sales, marketing, customer success, finance, and operations at least once a month.

Knowing how frequently to track specific metrics is an important piece of the puzzle. Doing it more frequently allows for timely course corrections and agile responses to market shifts. Of course, it’s important to differentiate actual changes in the market from short-term trends.
6. Most of them create complete reports
The majority of companies that reported hitting more than 75% of their goals in 2021 create comprehensive reports that include a variety of metrics. They analyze them, explain the results, and write the next steps and recommendations.

Comprehensive reports seem to be the way to go here. Including a variety of relevant metrics is definitely a must, as is ensuring that everyone who receives the report understands exactly what’s going on and what the next steps are.
7. Reports are predominantly shared via live dashboards
About 60% of the companies that reported hitting more than 75% of their goals in 2021 share their reports via live dashboards, while 57% of them present them in meetings (in person or via Zoom).

A significantly greater percentage of most successful companies use live dashboards compared to the general sample. This shows some degree of correlation between being able to track and present data in such a way and the ability to consistently achieve a large portion of one’s goals.
Standard and Advanced Reporting Practices [Infographic Summary]

Put Reporting on Auto-Pilot with Databox
Business reporting is more than a necessity. It’s a part of running or managing a business that cannot be overlooked. As we’ve seen, the most successful companies dedicate significant resources to their reporting efforts, from optimizing the number of metrics and using the best tools to being careful about their selection of KPIs.
This isn’t knowledge that can be gained overnight; it’s a process each business needs to go through on its own.
The reporting process itself, however? That can be streamlined and made much easier and more intuitive.
Enter Databox.
Databox allows users to either pick one of the pre-built dashboard templates or to build their own based on their own needs. Our tool supports over 70 one-click integrations, and you can use it to display any of the thousands of available metrics. With Databox Dashboards, you can minimize the effort it goes into collecting data and focus on actually implementing the strategies you’ve developed for your business.
But that’s not all!
Databox Reports are a feature that builds on Dashboards. It allows users to build a dashboard once and automate creating in-depth reports that are to be sent to stakeholders. With Reports, you can build a full presentation that includes a combination of data, text, and images in order to add context to your dashboards. They’re also fully customizable within the app, allowing you to create a complete report that echoes your visual identity.
Databox Dashboards are free forever, and Reports have a free trial that lasts 15 days.
Sign up for a free Databox account today and ensure your business reporting is always on point.


