


Table of contents
With so much experience under your belt, you already know a lot about business reporting.
So, we don’t want to waste your time pointing out the obvious because we know what you need.
Secrets. Tricks. Best practices.sales rep drilldown business report
The answer to how to write a mind-blowing business report that you don’t need to spend hours and days writing.
A business report that will immediately allow you to identify your strengths and weaknesses.
A report that’ll help you learn more about your business and do more accurate forecasting and planning for the future.
We believe we have just that right here.
With this comprehensive guide, you’ll create effective sales, analytical, and informative business reports (and business dashboards) that will help you improve your strategies, achieve your goals, and grow your business.
So, let’s dive in.
- What Is a Business Report?
- Importance of Creating Business Reports
- Types of Business Reports
- What Should Be Included in a Business Report?
- How to Write a Business Report: An 11-Step Guide
- Business Report Examples
What Is a Business Report?
Although there’s a variety of business reports that differ in many aspects, in short, a business report definition would be the following:
A business report is an informative document that contains important data such as facts, analyses, research findings, and statistics about a business with the goal to make this information accessible to people within a company.
Their main purpose is to facilitate the decision-making process related to the future of the business, as well as to maintain effective communication between people who create the reports and those they report to.
A good business report is concise and well-organized, looks professional, and displays the relevant data you can act on. The point is to reflect upon what you’ve achieved so far (typically, over the past month, quarter or year) and to use the data to create a new strategy or adjust the current one to reach even more business goals.
Business reports should be objective and based on the data. When stating the facts, people rely on numbers rather than giving descriptions. For instance, instead of saying “our conversion rate skyrocketed”, you would display the exact percentages that back up that claim.
Build automated reports and make better decisions
Report what happened, what changed, then talk about what to do next.
Importance of Creating Business Reports
Business reporting matters for several reasons, among which the most important ones are:
- Recognizing Opportunities to Grow
- Detecting Issues and Solving Them Quickly
- Evaluating a Potential Partner
- Having a Paper Trail
- Keeping Things Transparent for the Stakeholders
- Setting New Company Goals
In fact, over half of the companies that contributed to Databox’s state of business reporting research confirmed that regular monitoring and reporting brought them significant concrete benefits.
Recognizing Opportunities to Grow
If you never look back at what you’ve achieved, you can’t figure out what you’ve done well and what you can leverage in the future for even better results.
When you analyze a specific aspect of your business over a specific time period and present the data you gathered in a report, you can detect an opportunity to grow more easily because you have all the information in one place and organized neatly.
Is it time to introduce new products or services? Is there a way to enhance your marketing strategy? Prepare a report. Can you optimize your finances? Write a financial business report. Whatever decision you need to make, it’s easier when you base it on a report.
Detecting Issues and Solving Them Quickly
Reports are essential for crisis management because they can introduce a sense of calmness into your team. Putting everything on paper makes it easier to encompass all the relevant information and when you know all the facts, you can make a more accurate and effective decision about what to do next.
Writing business reports regularly will also help you identify potential issues or risks and act timely to prevent damage and stop it from escalating. That’s why monthly reporting is better than doing it only once a year.
Having an insight into your finances, operations and other business aspects more regularly allows you to have better control over them and mitigate potential risks more effectively.
Evaluating a Potential Partner
Different types of business reports may be accessible to the general public. And if they’re not, specific situations may require a company to send them over to the person requesting them. That may happen if you’re considering a partnership with another company. Before making the final decision, you should learn about their financial health as every partnership poses a certain risk for your finances and/or reputation. Will this decision be profitable?
Having an insight into a company’s business report helps you establish vital business relationships. And it goes the other way around – any potential partner can request that you pull a business report for them to see, so writing business reports can help you prove you’re a suitable business partner.
Having a Paper Trail
In business, and especially in large companies, it’s easy to misplace information when it’s communicated verbally. Having a written report about any aspect of your business doesn’t only prevent you from losing important data, but it also helps you keep records so you can return to them at any given moment and use them in the future.
That’s why it’s always good to have a paper trail of anything important you want to share with colleagues, managers, clients, or investors. Nowadays, of course, it doesn’t have to literally be a paper trail, since we keep the data in electronic form.
Keeping Things Transparent for the Stakeholders
Writing business reports helps you keep things transparent for the stakeholders, which is the foundation of efficient communication between these two sides.
You typically need to report to different people – sometimes they’re your managers, sometimes they’re a client. But your company’s stakeholders will also require an insight into the performance of your business, and relying on reports will help you maintain favorable business relationships. A business report shows you clearly how your company is performing and there isn’t room for manipulation.
Stakeholders often want a deeper explanation — not just what happened, but why. Reviewing trends across multiple periods and metrics can quickly become time-consuming. With Databox MCP, you can ask focused questions about performance and receive answers grounded in your actual business data and historical results from AI. The responses explain changes clearly and reference the same definitions you and your team already use, making it easier to add accurate interpretation and context to reports without manually cross-checking multiple data sources.
Setting New Company Goals
Once you set business goals and the KPIs that help you track your progress towards them, you should remember they’re not set in stone. From time to time, you’ll need to revisit your goals and critical metrics and determine whether they’re still relevant.
When you write a business report and go through it with your team members or managers, you have a chance to do just that and determine if you’re efficient in reaching your goals. Sometimes, new insights will come up while writing these reports and help you identify new objectives that may have emerged.
Types of Business Reports
Depending on your goals and needs, you’ll be writing different types of business reports. Here are five basic types of business reports.
Informational Report
Informational reports provide you with strictly objective data without getting into the details, such as explaining why something happened or what the result may be – just pure facts.
An example of this type of business report is a statement where you describe a department within your company: the report contains the list of people working in this department, what their titles are, and what they’re responsible for.
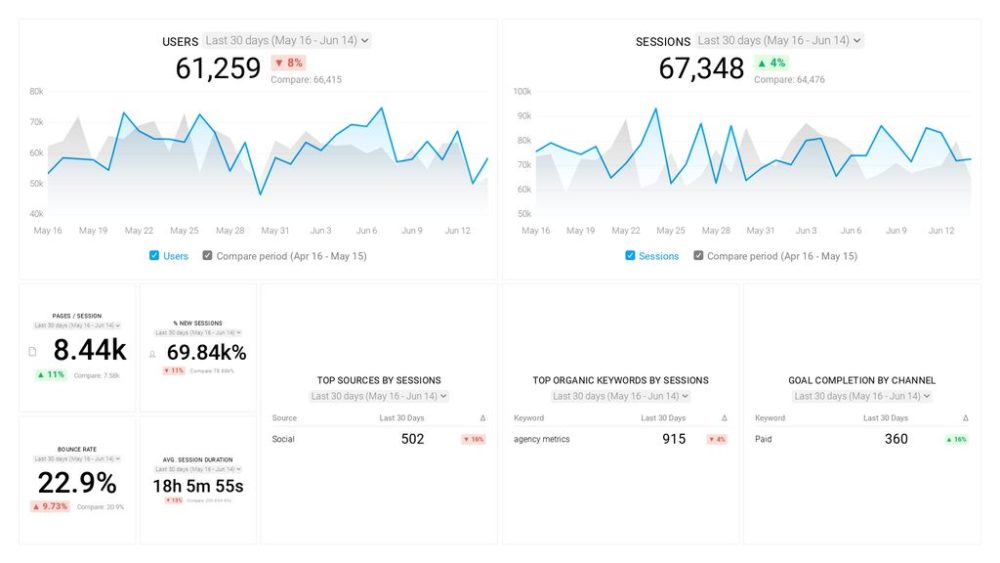
Another example related to a company’s website could look like this Google Analytics website traffic engagement report. As we explained above, this report shows objective data without getting too much into the details, so in this case, just the most important website engagement metrics such as average session duration, bounce rate, sessions, sessions by channel, and so on. Overall, you can use this report to monitor your website traffic, see which keywords are most successful, or how many returning users you have, but without further, in-depth analysis.
Analytical Report
Analytical reports help you understand the data you’ve collected and plan for the future based on these insights. You can’t make business decisions based on facts only, so analytical reports are crucial for the decision-making process.
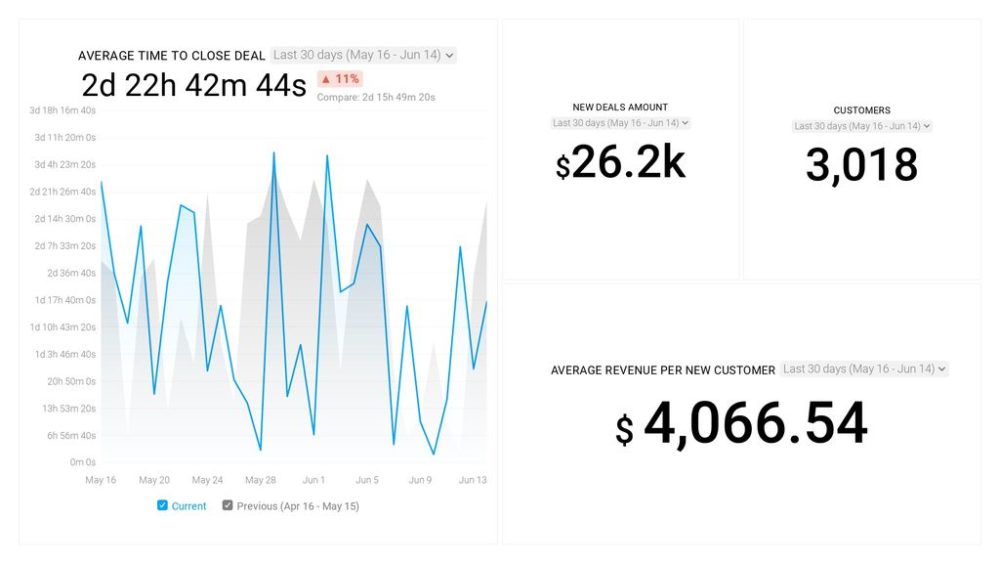
This type of business report is commonly used for sales forecasting. For instance, if you write a report where you identify a drop or an increase in sales, you’ll want to find out why it happened. This HubSpot’s sales analytics report is a good example of what metrics should be included in such a report, like average revenue per new client or average time to close the deal. You can find more web analytics dashboard examples here.
From these business reports, you can find out if you will reach your goals by implementing your current strategy or if you need to make adjustments.
Research Report
Research is critical when you’re about to introduce a change to your business. Whether it’s a new strategy or a new partner, you need an extensive report to have an overview of all important details. These reports usually analyze new target markets and competition, and contain a lot of statistical data.
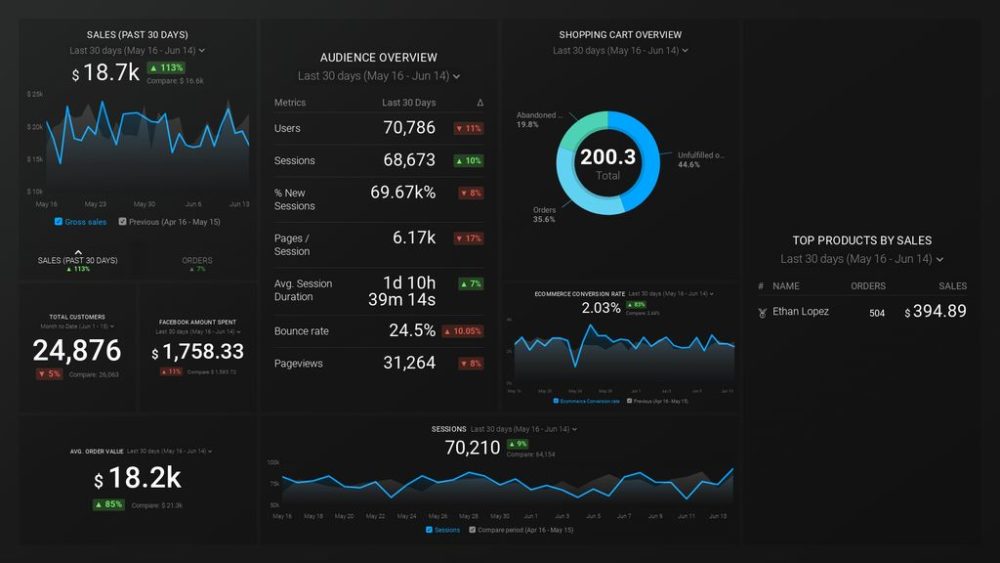
While not the same, here is an example of an ecommerce dashboard that could help track each part of a campaign in detail, no matter whether you are launching a new product, testing a new strategy, and similar. Similar to a research report, it contains key data on your audience (target market), shows your top-selling products, conversion rate and more. If you are an online store owner who is using paid ads, you can rely on this report to monitor key online sales stats in line with Facebook Ads and Google Analytics. See more ecommerce dashboards here.
Explanatory Report
As you might guess from its name, you write the explanatory report when it’s necessary for you to explain a specific situation or a project you’ve done to your team members. It’s important to write this report in a way that everyone will be able to understand.
Explanatory reports include elements like research results, reasons and goals of the research, facts, methodology, and more. While not exactly an explanatory report, this example of a HubSpot marketing drilldown report is the closest thing to it, as it helps marketers drill into an individual landing page performance, and identify how good their best landing pages are at converting, or which ones have the best performance.

Progress Report
A progress report is actually an update for your manager or client – it informs them about where you stand at the moment and how things are going. It’s like a checkpoint on your way towards your goal.
These reports may be the least demanding to write since you don’t need to do comprehensive research before submitting them. You just need to sum up your progress up to the point when the report was requested. This business report may include your current results, the strategy you’re implementing, the obstacles you’ve come across, etc. If this is a marketing progress report you can use marketing report templates to provide a more comprehensive overview.
In many companies, progress reports are done on a weekly or even daily basis. Here is an example of a daily sales report from Databox. HubSpot users can rely on this sales rep drilldown business report to see how individual each sales rep is performing and measure performance against goals. Browse through all our KPI dashboards here.
What Should Be Included in a Business Report?
What does a great business report look like? If you’re not sure what sections your report should have, you’ll learn what to include in the following lines.
Business Report Formatting
Different types of reports require different lengths and structures, so your business report format may depend on what elements your report needs to have. For example, progress reports are typically pretty simple, while analytical or explanatory reports are a different story.
However, most reports will start with a title and a table of contents, so the person reading the report knows what to expect. Then, add a summary and move on to the introduction. After you’ve written the body and the conclusion, don’t forget to include suggestions based on your findings that will help your team create an actionable plan as you move forward.
After that, list the references you used while creating the report, and attach any additional documents or images that can help the person reading the report understand it better.
This outline may vary depending on what kind of report you’re writing. Short business reports may not need a table of contents, and informative reports won’t contain any analyses. Also, less formal reports don’t need to follow a strict structure in every situation.
Business Report Contents
When it comes to the contents of your report, keep in mind the person who’s going to read it and try to balance between including all the relevant information, but not overwhelming the reader with too many details.
- The introduction to the report should state the reason why you’re writing it, and what its main goal is. Also, mention what methodology and reporting software you’ve used, if applicable.
- The body of the report is where you’ll expose all your key findings, explain your methodology, share the important data and statistics, and present your results and conclusion.
- The conclusion, similarly to the summary you’ll add at the beginning of the report, briefly singles out the most important points and findings of the report.
If you decide to include more sections like recommendations, this is where you’ll suggest the next steps your team or the company may want to take to improve the results or take advantage of them if they’re favorable.
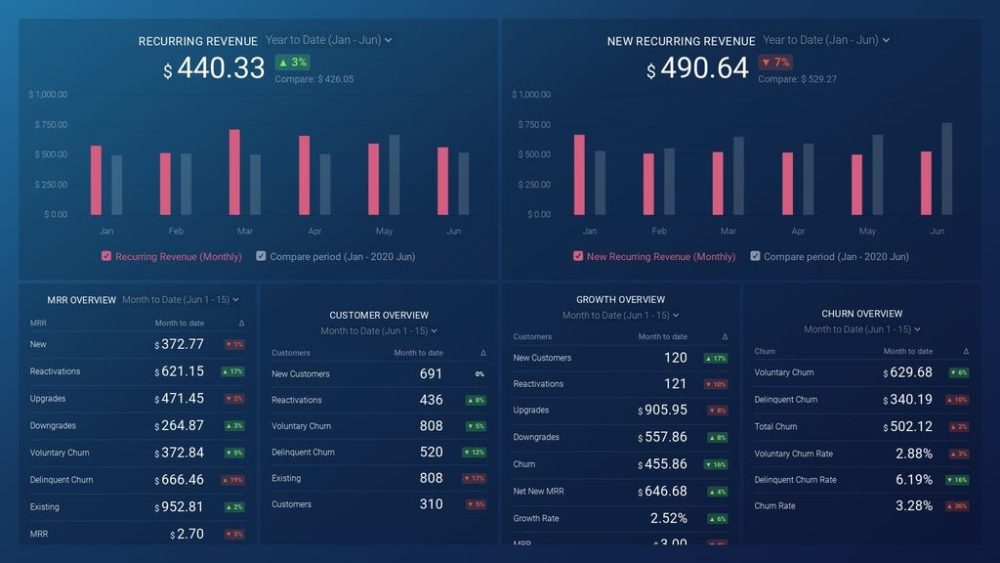
PRO TIP: Are You Tracking the Right Metrics for Your SaaS Company?
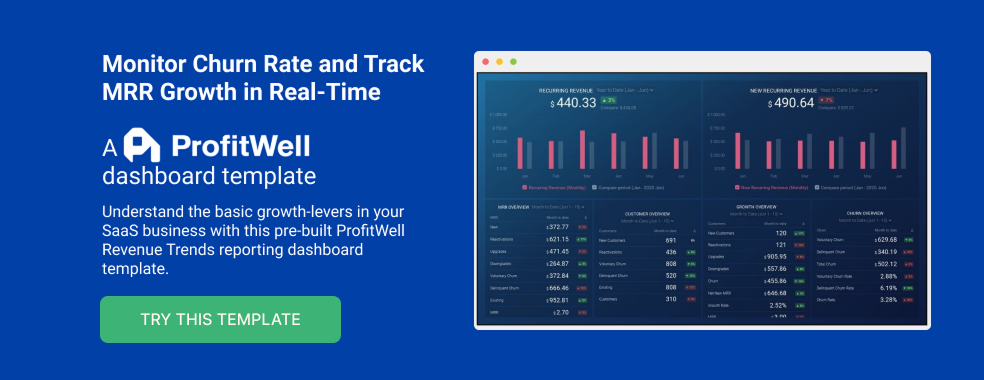
As a SaaS business leader, there’s no shortage of metrics you could be monitoring, but the real question is, which metrics should you be paying most attention to? To monitor the health of your SaaS business, you want to identify any obstacles to growth and determine which elements of your growth strategy require improvements. To do that, you can track the following key metrics in a convenient dashboard with data from Profitwell:
- Recurring Revenue. See the portion of your company’s revenue that is expected to grow month-over-month.
- MRR overview. View the different contributions to and losses from MRR from different kinds of customer engagements.
- Customer overview. View the total number of clients your company has at any given point in time and the gains and losses from different customer transactions.
- Growth Overview. Summarize all of the different kinds of customer transactions and their impact on revenue growth.
- Churn overview. Measure the number and percentage of customers or subscribers you lost during a given time period.
If you want to track these in ProfitWell, you can do it easily by building a plug-and-play dashboard that takes your customer data from ProfitWell and automatically visualizes the right metrics to allow you to monitor your SaaS revenue performance at a glance.
You can easily set it up in just a few clicks – no coding required.
To set up the dashboard, follow these 3 simple steps:
Step 1: Get the template
Step 2: Connect your Profitwell account with Databox.
Step 3: Watch your dashboard populate in seconds.
Note: Other than text, make sure you include images, graphs, charts, and tables. These elements will make your report more readable and illustrate your points.
How to Write a Business Report: An 11-Step Guide
Whether you’re writing a specific type of business report for the first time or you simply want to improve the quality of your reports, make sure you follow this comprehensive guide to writing an effective business report.
- Do Your Research
- Create an Outline
- Determine Formatting Guidelines
- Think of an Engaging Title
- Write the Introduction
- Divide the Body of the Report into Sections
- Choose Illustrations
- Conclude Effectively
- Gather Additional Documentation
- Add a Summary
- Proofread Your Work
Step 1: Do Your Research
A well-planned report is a job half done. That means you need to do research before you start writing: you need to know who you’re writing for and how much they know about the topic of your report. You need to explore the best business dashboard software and templates you can use for your report.
Also, if you believe you will need additional resources and documents to add in the appendix, you should do it during this phase of report writing.
Step 2: Create an Outline
Once you’ve gathered the resources, it’s time to plan the report. Before you start writing, create an outline that will help you stick to the right structure. A business report is complex writing in which you can get lost very easily if you don’t have a clear plan.
Moreover, the report shouldn’t be complicated to read, so sticking to a plan will allow you to keep it concise and clear, without straying from the topic.
Step 3: Determine Formatting Guidelines
Most companies have their in-house formatting that every official document has to follow. If you’re not sure if such rules exist in your company, it’s time you checked with your managers.
If there arent’ any guidelines regarding formatting, make sure you set your own rules to make the report look professional. Choose a simple and readable format and make sure it supports all the symbols you may need to use in the report. Set up proper headings, spacing, and all the other elements you may need in Word or Google Docs.
Pro tip: Google Docs may be easier to share with people who are supposed to read your business report.
Step 4: Think of an Engaging Title
Even if you’re writing a formal business report, the title should be clear and engaging. Reports are typically considered dull as they’re a part of official business documentation, but there’s no reason why you can’t make them interesting to read. Your title should suit the report topic and be in different font size so the reader can recognize it’s a title. Underneath the title, you should add the name of the author of the report.
Step 5: Write the Introduction
A good introductory paragraph for a business report should explain to the reader why you’ve written the report. Use the introduction to provide a bit of background on the report’s topic and mention the past results if there’s been a significant improvement since your last report.
Step 6: Divide the Body of the Report into Sections
As this will be the most comprehensive part of your report, make sure you separate the data into logical sections. Your report is supposed to tell a story about your business, and these sections (such as methodology, hypothesis, survey, findings, and more) will help the data look well-organized and easy to read.
Step 7: Choose Illustrations
Of course, each of these sections should be followed with charts, graphs, tables, or other illustrations that help you make a point. Survey results are typically best displayed in pie charts and graphs, and these enable the reader to visualize the data better. From the formatting point of view, breaking the long text sections with illustrations makes the report more readable.
Pro tip: Using centralized dashboard solutions like Databox can bring your reporting game to the next level. Sign up for a free trial now to see how you can use Databox to track and visualize performance easier than ever before.
Step 8: Conclude Effectively
Finish your report with a to-the-point conclusion that will highlight all the main data from the report. Make sure it’s not too long, as it’s supposed to be a summary of the body of the report. In case you don’t want to add a specific section for recommendations, this is where you can include them, along with your assessments.
Step 9: Gather Additional Documentation
If you’ve determined what additional documents, images, surveys, or other attachments you may need for your report, now is the time to collect them. Request access to those you may not be able to get on time, so you have everything you need by the deadline. Copy the documents you can use in the original form, and scan the documents you need in electronic format.
Step 10: Add a Summary
The summary is usually at the top of the report, but it’s actually something you should write after your report is completed. Only then will you know exactly what your most relevant information and findings are, so you can include them in this brief paragraph that summarizes your report’s main points.
The summary should tell the reader about the objective of the report, the methodology used, and even mention some of the key findings and conclusions.
Step 11: Proofread Your Work
It may seem like common sense, but this final step of the process is often overlooked. Proofreading your work is how you make sure your report will look professional because errors can ruin the overall impression the reader will form about your work, no matter how great the report is.
Look for any spelling or grammatical mistakes you can fix, and if you’re not sure about specific expressions or terminology, use Google to double-check it. Make sure your writing is to-the-point and clear, especially if you’re writing for people who may not know the industry so well. Also, double-check the facts and numbers you’ve included in the report before you send it out or start your reporting meeting.
Business Report Examples (with Ready-to-Use Templates)
Here, we’re sharing a few business reporting examples that you can copy, along with ready-to-use templates. If you don’t know where to start and what to include in different types of business reports, these business report examples are a great way to get started or at least get some inspiration to create yours.
- Activity Report Example
- Annual Report Example
- Project Status Report Example
- Financial Report Example
- Sales Report Example
- Marketing Report Example
Note: Each of the business report templates shared below can be customized to fit your individual needs with our DIY Dashboard Designer. No coding or design skills are necessary.
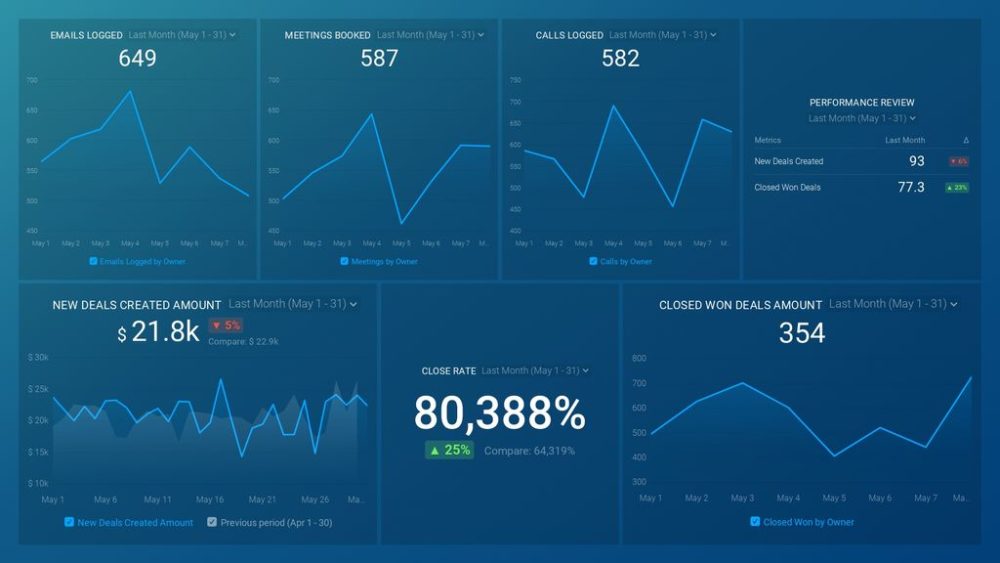
Activity Report Example
For reporting on sales activity, HubSpot users can rely this streamlined sales activity report that includes key sales metrics, such as calls, meetings, or emails logged by owner. This way, you can easily track the number of calls, meetings, and emails for each sales rep and identify potential leaks in your sales funnel. Check all our sales team activity dashboards here. Or if you are looking for dashboards that track general sales performance, browse through all Databox sales dashboards here.

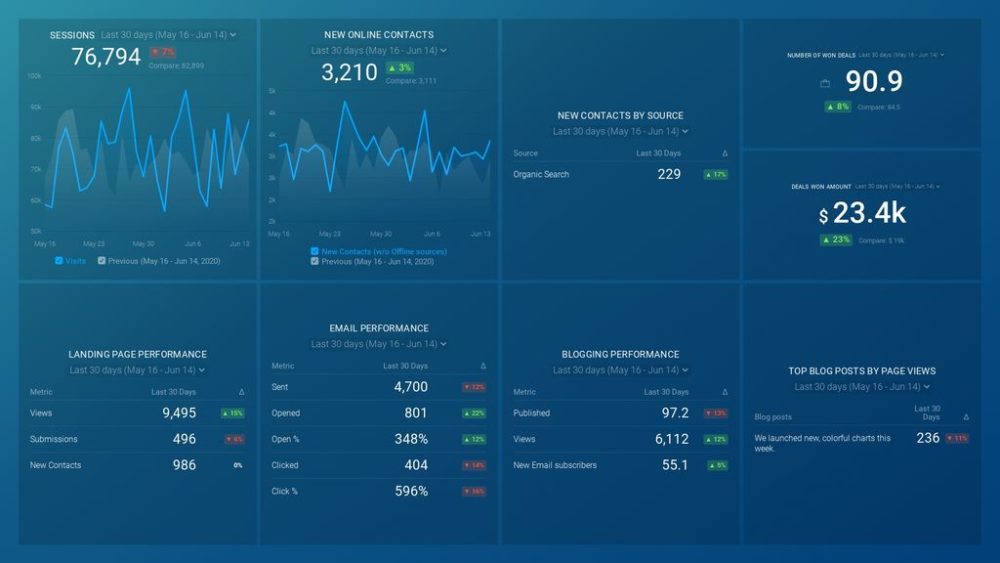
Annual Report Example
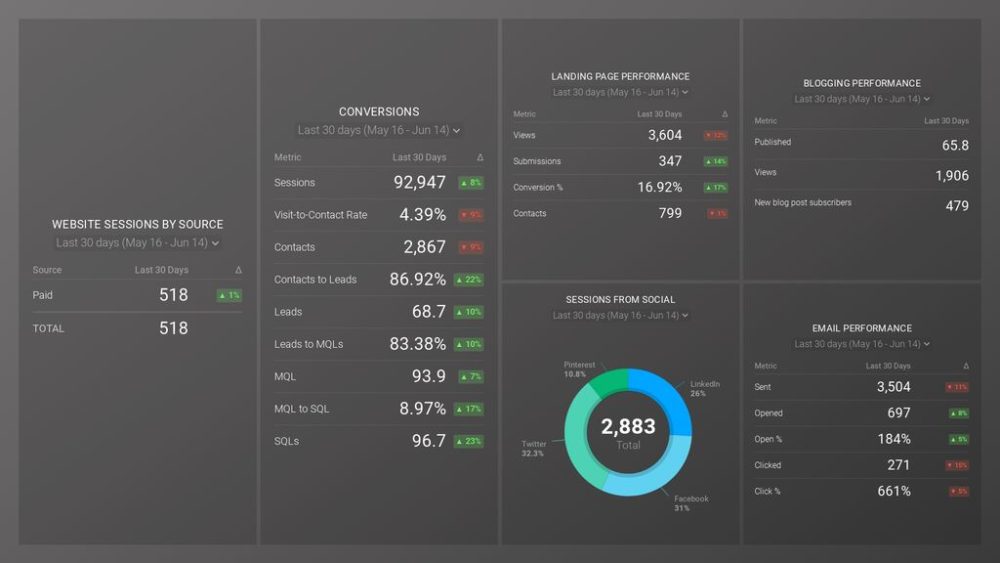
If you’re preparing for annual reporting, you will benefit from choosing this HubSpot annual performance report. It contains all the relevant metrics, such as email and landing page performance, new contacts, top blog posts by page views, and more. See all our performance dashboard templates here.
Project Status Report Example
Project status reports can be very similar to progress reports. If you’re in need of one of those, here’s an example of a Project overview dashboard from Harvest that shows that can help you create simple, but well-organized report based on metrics that matter: hours tracked, billable hours, billable amount split by team members., and more. Check out more project management dashboard templates we offer here.

Financial Report Example
Are you creating a financial report? You will find this QuickBooks + HubSpot integration a great choice for a financial performance dashboard that makes creating a report simple. This dashboard focuses on the essential financial report
ting metrics and answers all your revenue-related questions. See all Databox financial dashboards here.

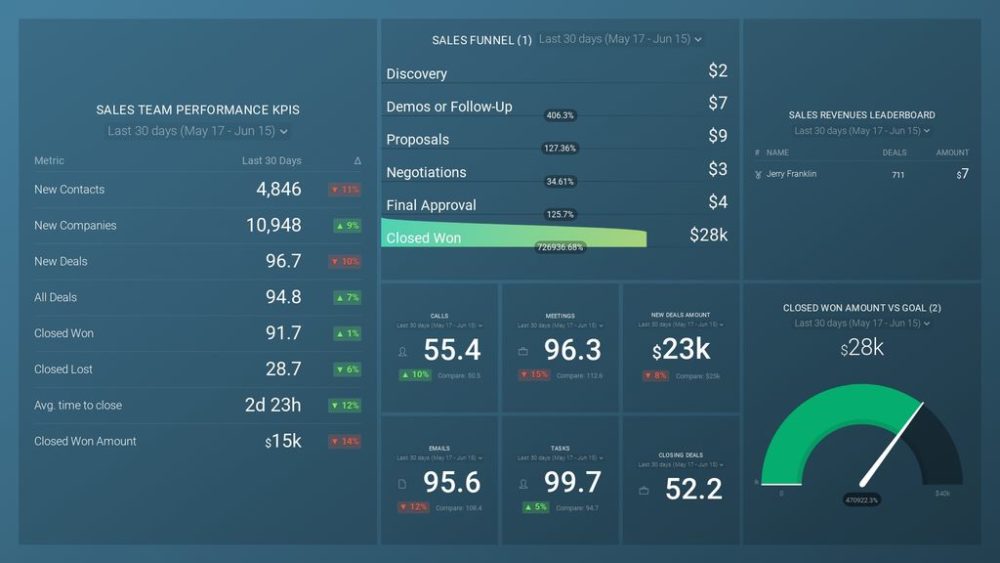
Sales Report Example
If you’re tracking your sales team’s monthly performance, this sales report template will help you prepare an outstanding report. Check out all the vital productivity KPIs, track your progress towards your goals, and understand well how your current sales pipeline is performing. See all sales performance dashboards we have available here.
Marketing Report Example
Marketing reports can be easily prepared by using this monthly marketing report template. With HubSpot’s reporting, you can determine where your website traffic is coming from, how your landing pages and specific blog posts are performing, and how successful your email campaigns are. Browse all Databox marketing dashboards or marketing report examples here.
Create a Professional Business Report in No Time with Databox
Does creating a business report still sound like a daunting task? It doesn’t have to be with Databox.
In times when we’re all trying to save our time and energy for things that matter rather than scattering valuable resources on tedious, repetitive tasks, it’s critical to optimize your business process. And we want to help you do just that.
Using a business reporting dashboard enables you to track data from all the different tools you’re using – but in one place. With Databox, you can monitor and report on performance in a single dashboard that is optimized for all your favorite devices and you can create streamlined and beautiful dashboards even if you are not that tech-savvy. (no coding or design skills are required).
Automating business reporting has never been easier. And with Databox, you can do exactly that in just a few clicks.


