Sales

40+ Free Sales Dashboard Examples and Templates

All sales dashboard templates come pre-built with some of the most commonly tracked metrics from the most popular tools. You can customize your templates at any time.

Create your free Databox account

Sales Leads Dashboard Examples and Templates

Track your sales leads from most popular sales tools from our library of pre-built templates. Just download any template for free, connect your data, and get instant visualizations of things like number of new leads, new leads by source, number of converted leads, new contacts, new contacts by source, and much more.

Sales Pipeline Dashboard Examples and Templates

Track the performance of your sales pipeline from the most popular sales tools from our library of pre-built templates. Just download any template for free, connect your data, and get instant visualizations of things like pipeline conversion rate, new lead by lead source, number of converted leads, expected revenue, and more.

CRM Dashboard Examples and Templates

Track your sales performance from some of the most popular CRM tools like HubSpot, Pipedrive and Salesforce from our library of pre-built templates. Just download any template for free, connect your data, and get instant visualizations of things like deals closed-won amount, deals created, closed-won revenue, deals by source, open deals amount by stage, and more.

Sales Performance Dashboard Examples and Templates

Track your sales team performance from the most popular sales tools from our library of pre-built templates. Just download any template for free, connect your data, and get instant visualizations of things like number of calls by sales rep, number of meetings by sales rep, amount of started deals, won and lost Deals, activities completed, and more.

Sales Funnel Dashboard Examples and Templates

Track the performance of your sales funnel from the most popular sales tools from our library of pre-built templates. Just download any template for free, connect your data, and get instant visualizations of things like New Contacts, New Leads, New MQLs, New SQLs, Deals Created, Deals Won, Closed Won Amount, and more.

Business Development Dashboard Examples and Templates

Track all of your business development metrics from the most popular sales tools from our library of pre-built templates. Just download any template for free, connect your data, and get instant visualizations of things like New Contacts, New Leads, New MQLs, New SQLs Deals Created, Deals Won, Closed Won Amount and more.

Events Dashboard Examples and Templates

Track your sales events from popular event management and ticketing websites like EventBrite from our library of pre-built templates. Just download any template for free, connect your data, and get instant visualizations of things like total tickets sold, total sales, event stats, sales by ticket type, and more.

Call Tracking Dashboard Examples and Templates

Track all of your sales call activity from tools like CallRail from our library of pre-built templates. Just download any template for free, connect your data, and get instant visualizations of things like watch time, average watch time, views, likes, and much more.

Sales Team Activity Dashboard Examples and Templates

Track the performance of your sales team from the most popular sales tools from our library of pre-built templates. Just download any template for free, connect your data, and get instant visualizations of things like sales goals, activities conducted by your sales reps, and much more.

Ready to visualize your marketing performance?

Build your dashboard with our DIY Dashboard Designer now.

Build your free dashboard now
Stars
4.5 out of 5 stars
G2
2023 Leader on the
Stars
4.8 out of 5 stars

More Dashboard Examples and Templates

Explore all the different ways you can use Databox to gain better data insights needed to drive better business decisions. Here are just a few examples of the departments and industries that use our pre-built templates on a daily basis to improve performance.

What is a Sales Dashboard?

A sales dashboard deals specifically with sales-specific metrics and data points. It provides important information at a glance and keeps you aware of any necessary metrics and performance standards, ultimately enabling you to make better data-driven decisions.

The entire sales team can benefit from using sales performance dashboards, starting from sales management to operations and individual account executives (sales representatives).

Since sales dashboards give you a real-time view of your sales process and operations’ health, they can help you make smarter and more informed revenue predictions, see which sales reps are closing deals successfully and identify areas for sales process optimization.

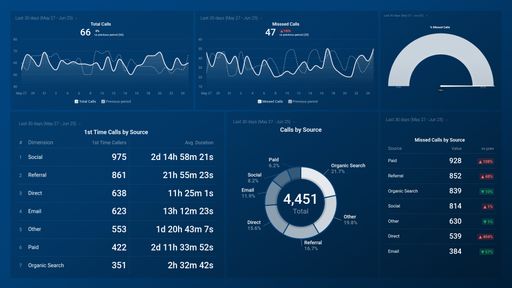
A sales representative dashboard can enable sales teams to visualize numerous sales KPIs, including average hold time, revenue-per-rep, call abandonment rates, dials-per-rep by hour, and similar.

All in all, with the right sales rep dashboard, you can easily track the health of your sales, get a holistic view of all activities and tasks carried out by each sales representative to ensure your team members are hitting their goals, and see whether you need to speed up (or slow down) your sales process. It’s an effective way to keep your sales performance — and your sales goals — organized and continuously updated.

What Should Be Included in a Sales Reporting Dashboard?

Which metrics will be included in your sales dashboard depends on your industry, type of sales, company size, and other factors. Also, based on current motives, company offerings, and personal and departmental sales goals, some KPIs may need to be changed from week to week. This particularly applies to sales representative dashboards where you want to track the performance of individual sales reps. All in all, your sales dashboard will be unique to your company and your customers’ needs.

To identify what information should be included in your sales performance dashboard, try answering the following questions:

  • Which metrics and data points show up the most in your reports?
  • Are there any metrics in sales team meetings or one-on-one salesperson reviews that are regularly reviewed or seen as more important than others?
  • What are your key performance indicators (KPIs)?
  • Do you have multiple sales teams?

No matter what your answers to these questions are, keep in mind that sales performance dashboards are most effective when they give you an overview while ensuring you know the details, too.

Some of the most important big-picture metrics include:

  • Individual salesperson performance
  • Pipeline performance
  • Forecasts
  • Your competitors
  • Product performance

With that in mind, the perfect sales dashboard should include a combination of the following sales metrics and KPIs that allow you to dig deeper into your sales performance:

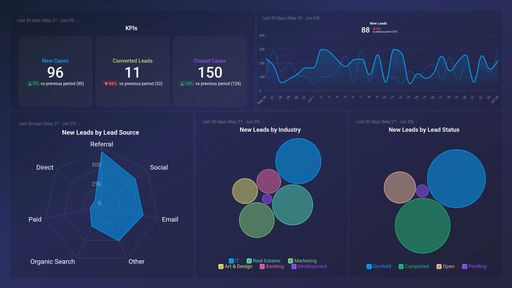
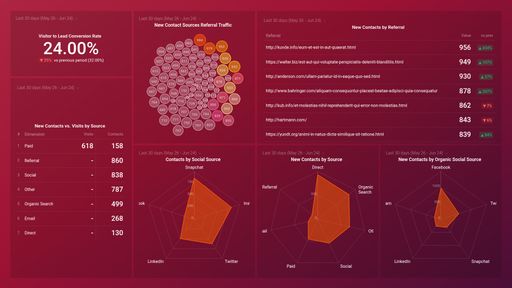
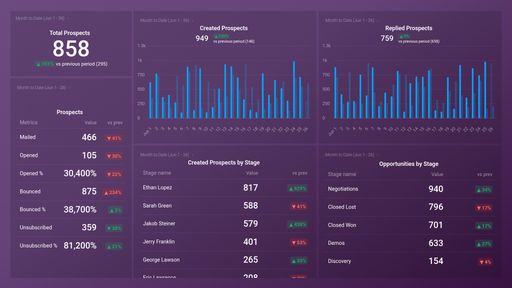
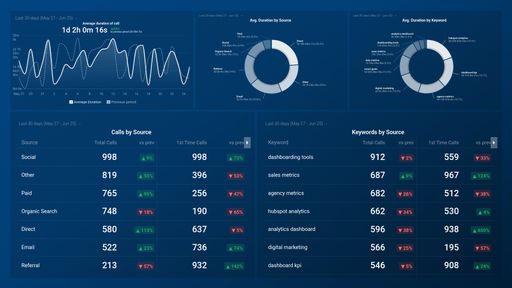
  • Leads by source – gain insight into where your customers are coming from and how to classify leads.
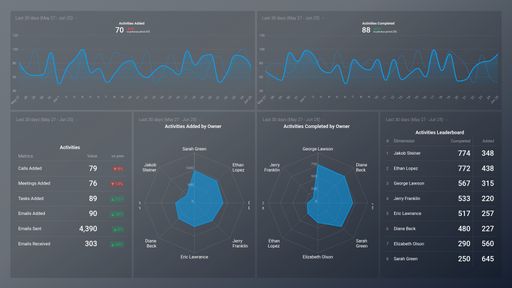
  • Open activities (calls, demos, visits) – Necessary to stay proactive in your sales efforts, but you shouldn’t have too many.
  • Open cases – Opened when a customer initiates contact. Time-sensitive.
  • Open opportunities – Use this metric to track your leads and delegate when you have too many.
  • Opportunities past due – Your goal is to keep this to a minimum.
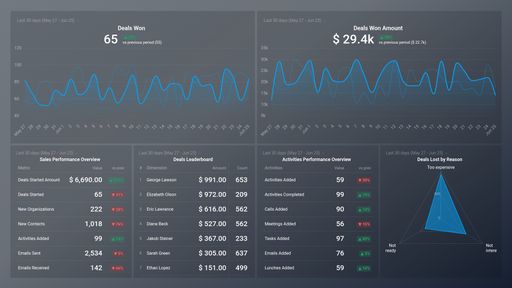
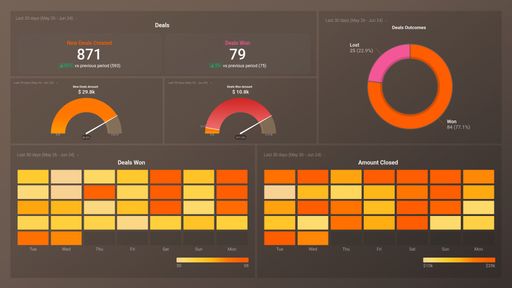
  • Closed opportunities – See how much revenue your sales have generated.
  • Sales cycle – The average duration of time it takes a salesperson or your team to win a deal.
  • Pipeline – See what stage each open opportunity is in and how close they are to being finalized.
  • Sales by closed date– It helps forecast, find trends, and gauge how long customers take to convert.
  • New business and upsell ratio – Helps you stay on track with balancing new business with upsells.
  • Win/loss rate – Percentage of opportunities proposed or quotes that you won.
  • Product gaps – See how your offerings are actually performing in sales versus how they were predicted to sell.
  • Deals won vs Deals lost
  • Number of emails, meetings, and calls sent, booked and anwered each week
  • Average time to close a deal - Also helpful for understanding your average sales cycle lenght.
  • Deals leaderboard - Which one of your sales reps is the most successful at closing deals?

How to Create a Sales Dashboard

With our dashboard design wizard, building a dashboard in Databox is as simple as connecting a data source, choosing the metrics you need from our Metrics Library, and waiting for your data to populate -- which only takes a few seconds. No coding and design skills are required.

Create a new dashboard using our Designer tool
Name your dashboard
Name your dashboard
Select a data source
Drag-and-drop pre-built metrics from that source to your dashboard or drag a blank visualization first and select the metric you’d like to associate with it.
Drag-and-drop pre-built metrics from that source to your dashboard
Customize each metric block by date range, comparisons, goals, and more.
Customize each metric block

Haven’t found what you’re looking for?

Whether you are looking for client reporting dashboards, agency dashboards, marketing dashboards, or sales dashboards, Databox can help you build them.

Let us know what you are trying to build and our team of experts will help you turn your data into actionable insights.

Build your free dashboard now