Uses one-click integrations:
-
 HubSpot CRM
If you don't use HubSpot CRM, you can pull data from any of our 130+ one-click, native integrations or from spreadsheets, databases and other APIs.
Try this dashboard for free
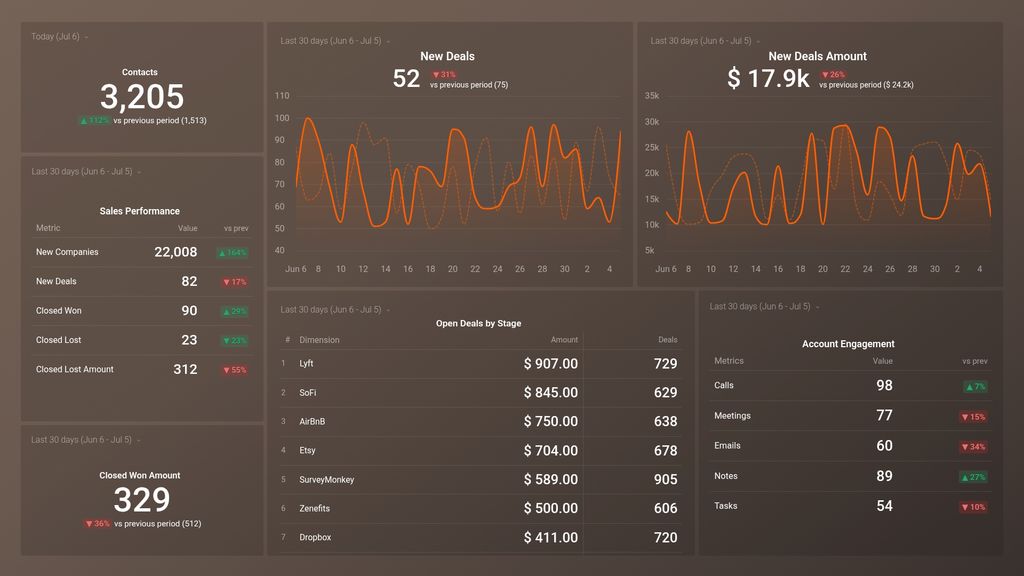
HubSpot CRM metrics included in this template
-
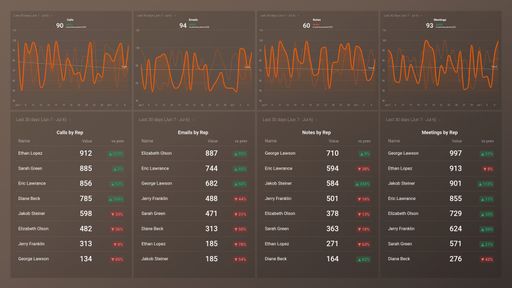
Calls
The Calls metric in HubspotCRM tracks the number of phone calls made between contacts and users in your account, allowing you to measure communication and outreach efforts and gather insights on potential sales opportunities.
-
Companies
The Companies metric in HubSpot CRM tracks the total number of companies in your database, providing valuable insights into the size and growth of your company's customer base.
-
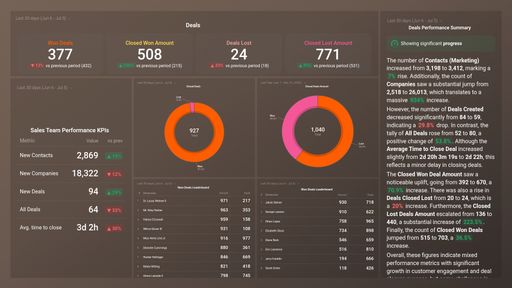
Contacts (Marketing)
The Contacts (Marketing) metric in Hubspot CRM refers to the total number of leads or contacts that have been added to the marketing database, through various channels such as website forms, landing pages, social media, email campaigns, etc. This metric helps evaluate the effectiveness of marketing efforts and indicates the potential customer base.
- Closed Lost Deals Amount
- Closed Won Deal Amount
-
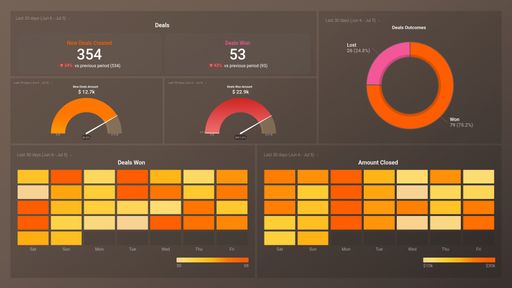
New Deals Created Amount
The New Deals Created Amount metric measures the total revenue generated from newly created deals in a given period of time. It helps businesses track the effectiveness of their sales efforts and identify areas for improvement.
-
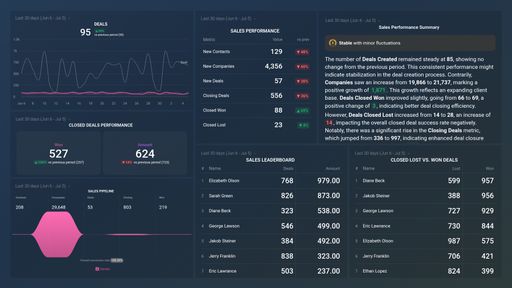
Open Deals Amount by Stage by Pipeline
This metric shows the total monetary value of open deals in each stage of the sales pipeline, categorized by different sales processes.
-
Deals Closed Lost
Deals Closed Lost is a metric that measures the number of deals that have been fully progressed through the sales cycle but ultimately did not result in a sale or were lost to a competitor.
-
Open (Unclosed) Deals by Stage by Pipeline
This metric allows you to track the number of open deals that have not been closed yet, categorized by their current stage in the pipeline.
-
Emails Logged
The Emails Logged metric in HubSpot CRM tracks the number of emails sent and received by your team within the CRM, providing insights into communication activity and engagement with contacts.
-
Meetings
The Meetings metric in HubSpot CRM measures the number of scheduled and completed meetings with your contacts. It helps to track the effectiveness of your sales and marketing tactics and optimize your outreach strategy.
-
Notes
The Notes metric in HubspotCRM refers to the number of notes added to a particular contact, company or deal record. It helps to keep track of communication and relevant information related to a record.
-
Tasks Completed
The Tasks Completed metric in Hubspot CRM shows the number of tasks that have been marked as completed by team members within the specified time period. This provides insight into individual and team productivity and helps track progress towards goals and deadlines.