Uses one-click integrations:
-
 HubSpot CRM
If you don't use HubSpot CRM, you can pull data from any of our 130+ one-click, native integrations or from spreadsheets, databases and other APIs.
Try this dashboard for free
HubSpot CRM metrics included in this template
-
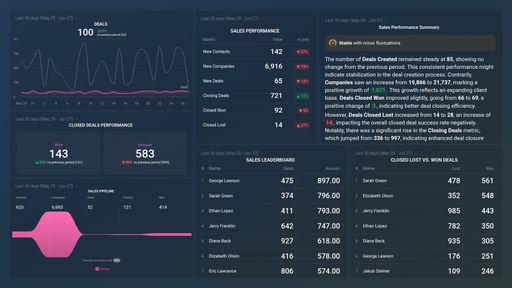
All Deals
The All Deals metric in HubspotCRM provides a comprehensive overview of all deals in the sales pipeline, including the total number of deals, their total value, and their current stage.
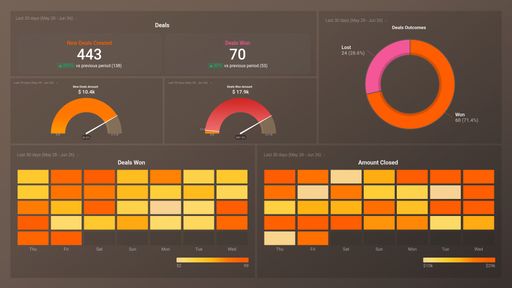
- New Deals Created Amount by Owner
-
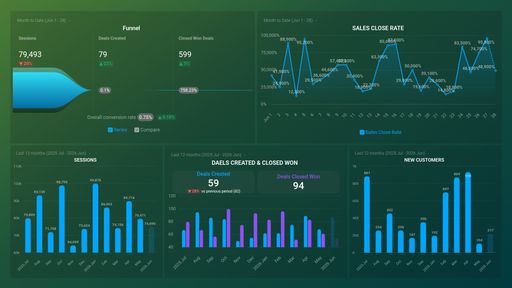
Closed Won by Owner
A metric that measures the total revenue generated by a sales owner from deals that were successfully closed in Hubspot CRM.
-
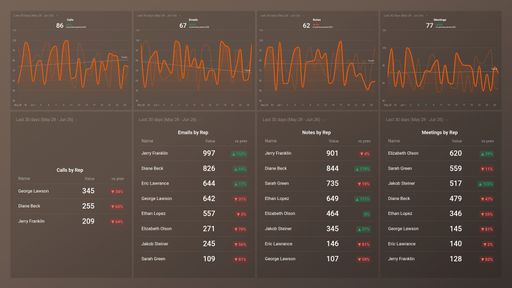
Deals Created by Owner
Deals Created by Owner is a metric that measures the number of deals that were created by a specific owner within a given time period, providing insight into individual team member's sales performance.