Uses one-click integrations:
-
 Google Analytics 4
-
 HubSpot CRM
-
 ProfitWell
If you don't use Google Analytics 4, HubSpot CRM or ProfitWell, you can pull data from any of our 130+ one-click, native integrations or from spreadsheets, databases and other APIs.
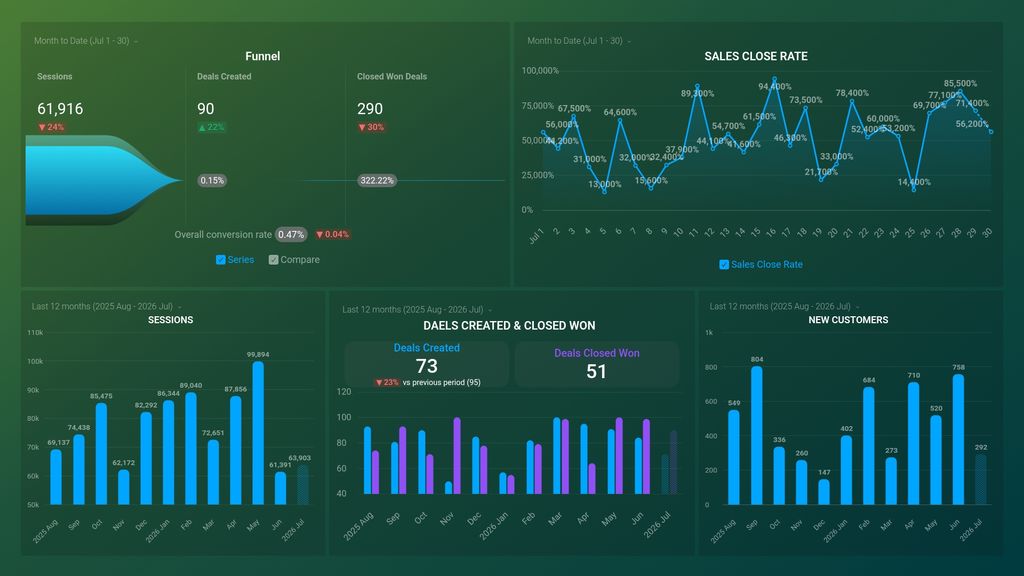
Try this dashboard for freeWhat you’ll learn from this SaaS Acquisition Funnel (GA4 + Mixpanel + Profitwell) Dashboard Template:
By connecting your Google Analytics 4, Mixpanel, and Profitwell accounts, you’ll learn the following:
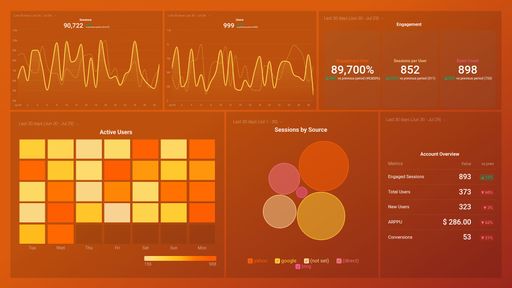
- How do your conversion numbers change in real time? Track the number of conversions and see how close you are to reaching your weekly, monthly, or quarterly goals. This will help you take action if you see that you are not on track to hitting the numbers you were expecting and hopefully change the outcome in your favor.
- Are your sessions trending up or down? Identify the specific channels that bring in the most sessions to your website. This will help you focus your efforts where you are most likely to see an ROI when it comes to increasing the number of sessions. Whether it is upping your Facebook Ads budget or investing more in your Email campaigns.
- Track your acquisition funnel live. See how many of your sessions end up being new subscriptions and in which part of your funnel you lose the most potential users.
- Are you on the trajectory to hit your signups goal? You can discover what are the most interesting pages on your website based on the number of views for each page path. This can help you better understand their needs and where on your website they get the most value from.
What else can you track and visualize with our deep integration with Google Analytics 4, Mixpanel, and Profitwell?
When it comes to tracking your finances, funnel and website, almost anything:
- Website Engagement
- MRR Overview
- Customer Overview
- Completion Rate by Funnel
- Website and app engagement
- Purchase paths of your users
- Event by name
- Monitor audience growth over time.
There are many, many different metrics and metric combinations you can track using Google Analytics 4. And in Databox, you can quickly visualize 100s of Google Analytics 4, Mixpanel and Profitwell metrics in a variety of different ways.
Read more about Databox’s Google Analytics 4, Mixpanel, and Profitwell integrations.
Explore more Mixpanel dashboards.