Uses one-click integrations:
-
 Outreach
If you don't use Outreach, you can pull data from any of our 130+ one-click, native integrations or from spreadsheets, databases and other APIs.
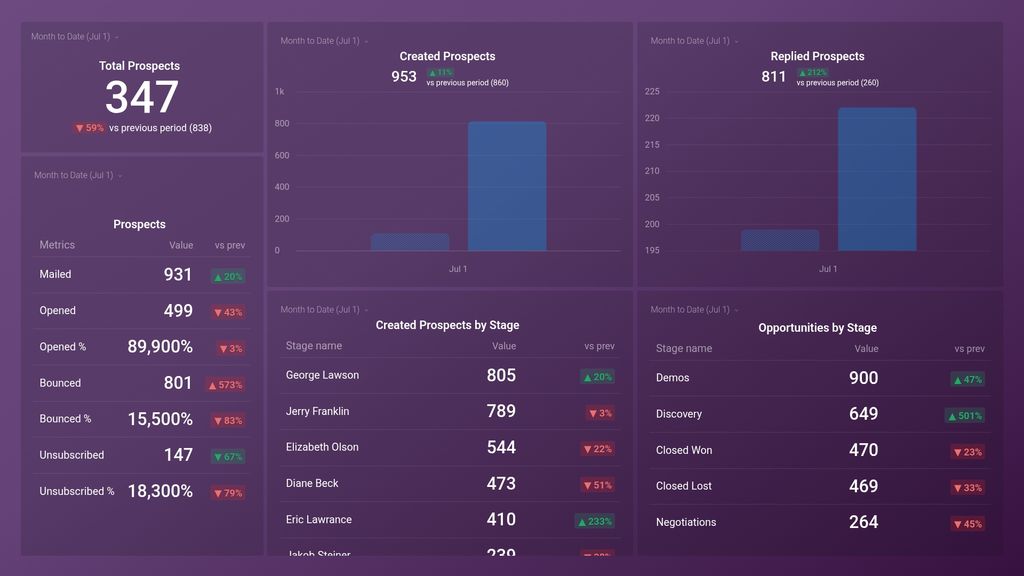
Try this dashboard for freeWhat you’ll learn from this Outreach Prospects Overview Dashboard Template:
With this Outreach Dashboard Template, you’ll be able to easily track and visualize every engagement made with prospects by you (and your team). Connect your Outreach account and learn:
- How many prospects were contacted today? Get a day-to-day update on the number of prospects created in Outreach by your team. Measure the number of prospects contacted daily against your set goal, is your team meeting the daily target? The more prospects your team contacts, the more likely your sales team will hit their quota for the month, due to the fact that sales prospecting brings in leads.
- How many prospects engaged with my sales team today? Track prospect replies to your sales team emails on a daily basis. By tracking this data, you’ll be able to tell how effective your campaigns are and how they are perceived by your subscribers based on how they engage with your emails.
- How many prospects received my last email? View the total number of prospects that received at least one email sent by your sales team within a specified time period.
- How many of our email recipients opened my sent email campaigns? Monitor how many prospects opened your sent email(s) within a given timeframe. Additionally, find out what percentage of your prospects actually opened your sent email(s). This is a great indicator of your prospect’s interest and behavior, as well as the effectiveness of your email subject line.
- What percentage of my prospect list did not receive my last email? Keep track of the number of emails that were not delivered and returned for whatever reason such as an invalid email address (hard bounce), a full mailbox, or a temporarily unavailable mail server (soft bounce). It is important to track this data as a high bounce rate is an indicator that your prospect list needs to be purged and updated.
- How do I track where my prospects are in the sales process? See where your prospects are in the sales cycle at any given time. The more visibility into your sales pipeline you and your team have, the better you will become at providing your prospective clients with everything they need to move from one stage to another.
Pull additional data using our deep integration with Outreach.
What else can you track and visualize with our deep integration with Outreach? When it comes to measuring your sales prospecting efforts, pretty much anything:
- Conversion rate
- Email engagement activity metrics (open rate, response rate)
- Activity ratio by team member (Calls, Dials, Emails per day)
- The average number of follow-ups
- Qualification rate
There are numerous metrics and metric combinations you can track using Outreach. And in Databox, you can quickly visualize dozens of Outreach metrics in various ways.
Read more about Databox’s Outreach integration.
Explore more Outreach dashboards.
Outreach metrics included in this template
-
Mailed Prospects
Mailed Prospects metric refers to the number of potential customers or clients who have been sent physical mail such as flyers, brochures, catalogs, or letters as part of a targeted outreach campaign.
-
Opened Prospects
The Opened Prospects metric measures the number of potential leads that have engaged with your outreach efforts by opening an email or message.
-
Opportunities by Stage
Opportunities by Stage metric tracks the number of open sales opportunities at different stages of the sales pipeline, providing insight on the potential revenue and sales performance.
-
Bounced Prospects
Bounced prospects is a measure of the number of emails that could not be delivered to a prospect's inbox, typically due to an invalid email address or full mailbox.
-
Created Prospects
Prospects is a metric used to measure the number of potential leads or customers for a product or service, providing insights for outreach efforts.
-
Created Prospects by Stage
The Created Prospects by stage metric measures the number of new potential customers added to each stage of the sales funnel within a given time period.
-
Replied Prospects
The Replied Prospects metric measures the percentage of prospects who responded to your outreach efforts, indicating interest and potential for follow-up.
- Bounced Prospects %
- Opened Prospects %
-
Unsubscribed Prospects
The Unsubscribed Prospects metric measures the number of people who have opted-out or unsubscribed from a marketing campaign or mailing list.