What you’ll learn from this Ahrefs Website Audit Dashboard Template:
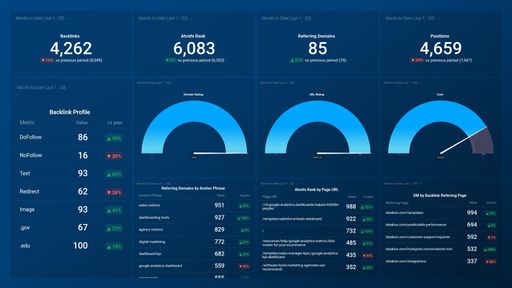
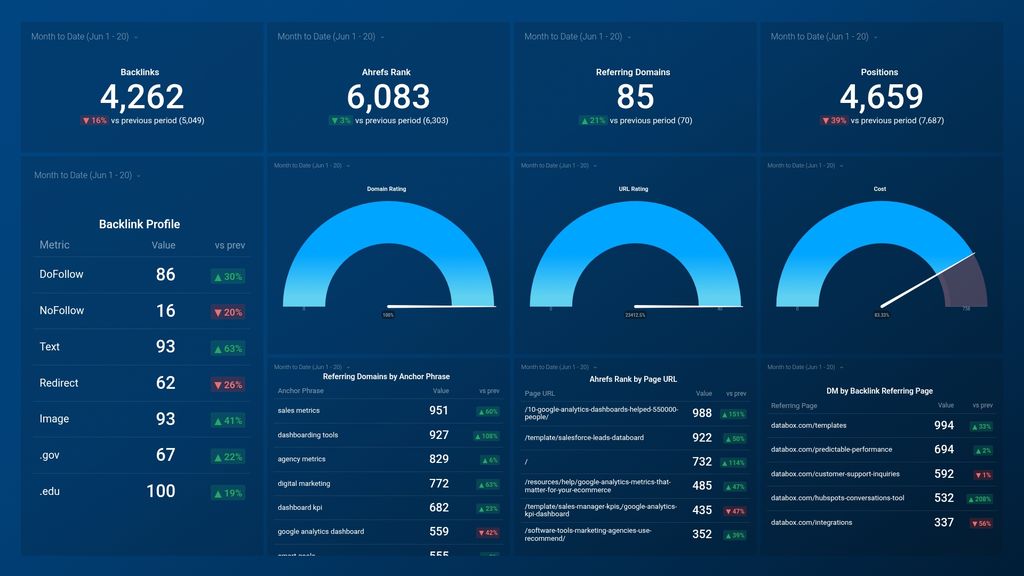
- How many backlinks does my website have? View the total number of incoming links to your website within a specific period of time. Get a comprehensive view of your site’s backlink profile, including backlinks, dofollow links, nofollow links, redirects, and more.
- How do I measure the strength of my website’s backlink profile? Measure the link popularity of your website in both size and quality on a scale of 1 to 100 at any given point in time. Also, examine the domain rating of each unique site linking to your website during a time period. The higher a site’s DR, the more link juice your website receives.
- How many referring domains are linking to my website? View the total number of websites linking to your website at any given point in time, as well as the number of unique referring domains pointing to your website. Ultimately, you want to ensure that at every point in time, you have a growing list of referring websites linking to your website, as this determines the strength of your backlink profile.
- What is my site’s Ahrefs rank? See how your website is currently ranking compared to other websites in Ahrefs database based on the size and quality of their backlink profiles. Additionally, track the Ahrefs rank of specific webpages and changes that might occur (drop or increase) month-over-month.
Pull additional data using our Ahrefs integration
What other campaign metrics can you track and visualize with Ahrefs?
- Estimated traffic
- Rankings distribution
- Visibility trend
- Keyword rankings
- Domain rating, and more
There are many different metrics and metric combinations you can track using these integrations. And in Databox, you can quickly visualize dozens of Ahrefs metrics in a variety of different ways.
Read more about Databox’s Ahrefs integration.
Explore more Ahrefs dashboards.