Uses one-click integrations:
-
 Salesforce CRM
If you don't use Salesforce CRM, you can pull data from any of our 130+ one-click, native integrations or from spreadsheets, databases and other APIs.
Try this dashboard for freeWhat you’ll learn from this Salesforce Expected Value of Sales Pipeline Dashboard Template
Connect your Salesforce account and learn:
- Where do most of my leads come from? Find out where leads to your website originate from. Also, see the total number of leads each specific source sent to your website within a given time period. It is useful to track this data as it lets you know which marketing channels drive the most value for your business.
- Which marketing channels drive the most opportunities for your business? See the original lead source for closing opportunities and the expected revenue to be generated once these opportunities are closed. By tracking where your most valuable leads come from, you’ll be able to determine what channels to focus on and/or if your lead generation strategy needs to be reviewed.
- How do I track revenue from closed deals? See how much revenue you’ve generated so far from closed deals for the chosen time period. Measure and analyze your progress against your sales goals, and use this data to forecast your quarterly numbers accurately.
- What is the total value of all deals in my sales pipeline? See how much revenue you stand to generate from opportunities that are expected to close within a specific timeframe. Note: This does not include revenue that has been earned from close deals.
- What is the total value of closed and expected revenue for this quarter? See how much revenue you generated from deals marked as Closed Won, as well as how much revenue you expect to generate from all deals in your pipeline that are set to close.
- How do I track my sales pipeline effectively? Get a holistic view of what is happening in your sales pipeline. See where your prospects are, and monitor how they progress through the different stages in their buying process.
Pull additional data using our deep integration with Salesforce.
What else can you track and visualize with our deep integration with Salesforce? When it comes to leads, sales & revenue, almost anything:
- Closed and won opportunities
- Win/loss rate
- Open activities (demos, calls, emails)
- Sales cycle
- Deal type
Explore more Salesforce dashboards.
Salesforce CRM metrics included in this template
- Closed and Pending
-
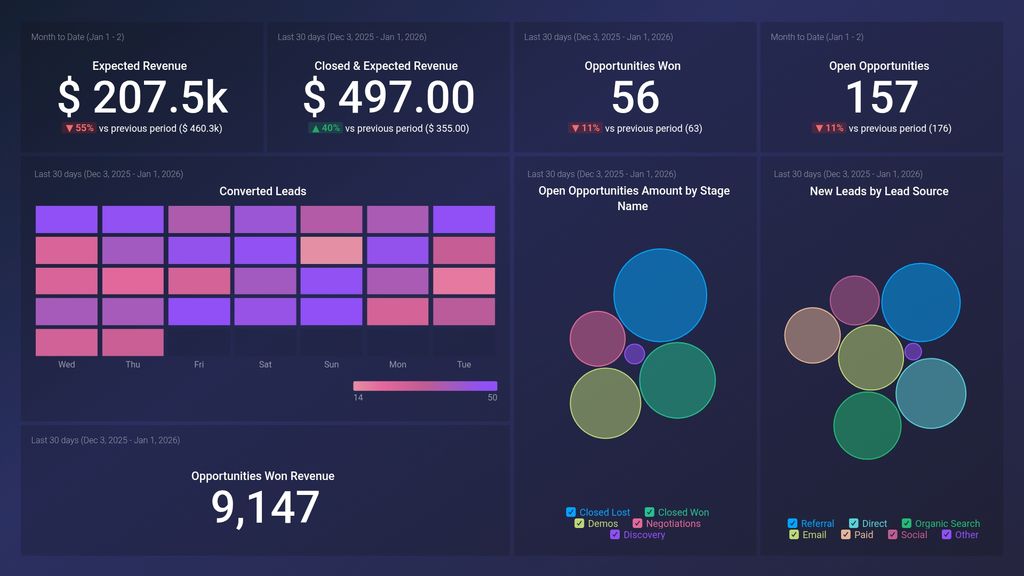
Converted Leads
The Converted Leads metric tracks the percentage of leads that have been converted into actionable accounts or contacts in Salesforce.
-
Expected Revenue
Expected Revenue is a metric in Salesforce that predicts the amount of revenue a sales team is likely to generate from their opportunities. It takes into account the probability of winning each opportunity and the value of the opportunity to calculate an expected revenue value.
-
New Leads by Lead Source
It shows the number of new leads generated from each lead source over a specific time period, providing insights into which sources are driving the most lead conversions and can help prioritize marketing efforts.
-
Open Opportunities Count
Open Opportunities Count is a metric that measures the number of deals that are still in progress and have not yet been won, lost, or cancelled.
-
Open Opportunities Amount by Stage Name
The Open Opportunities Amount by Stage Name metric displays the total dollar value of all open opportunities grouped by their current stage in the sales pipeline. It helps identify which stages have the highest potential revenue and aids in decision-making for sales forecasting and resource allocation.
-
Opportunities Won Count
Opportunities Won Count is a key performance indicator in Salesforce that measures the total number of won opportunities within a given time frame. It provides insights into the sales team's performance and can be used to track progress and identify areas for improvement.
-
Opportunities Won Revenue
Opportunities Won Revenue is a metric that reflects the total revenue earned from all closed deals won within a specified time frame.