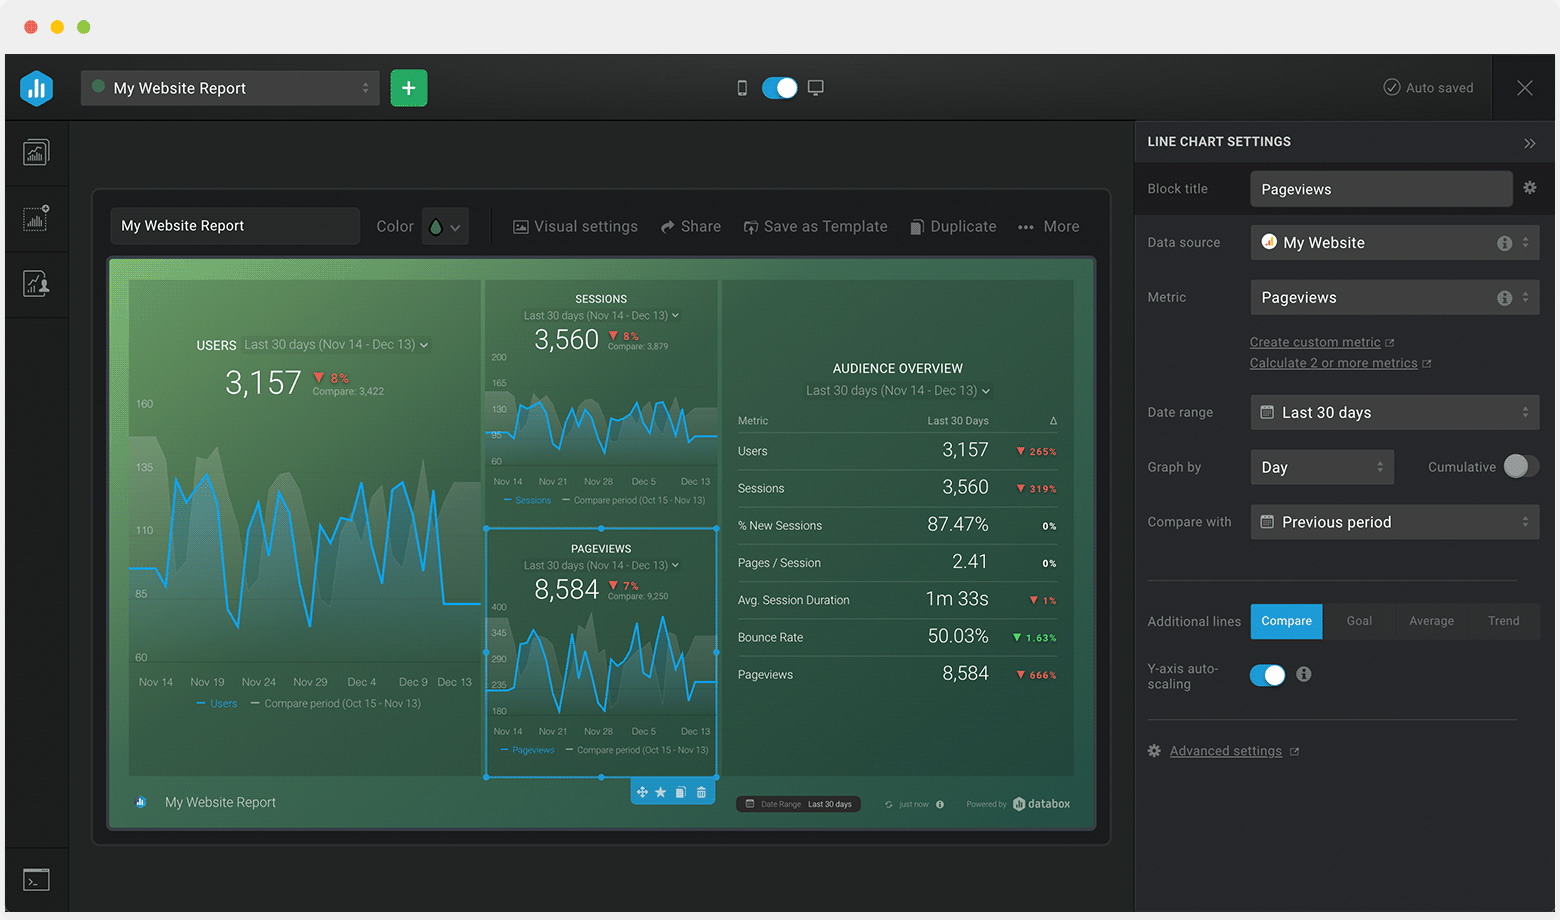
Track some of the most common Events metrics and KPIs and analyze your Events performance with just a few clicks.
You can build a dashboard with any data using Zapier, Make, Google Sheets, or a SQL database.

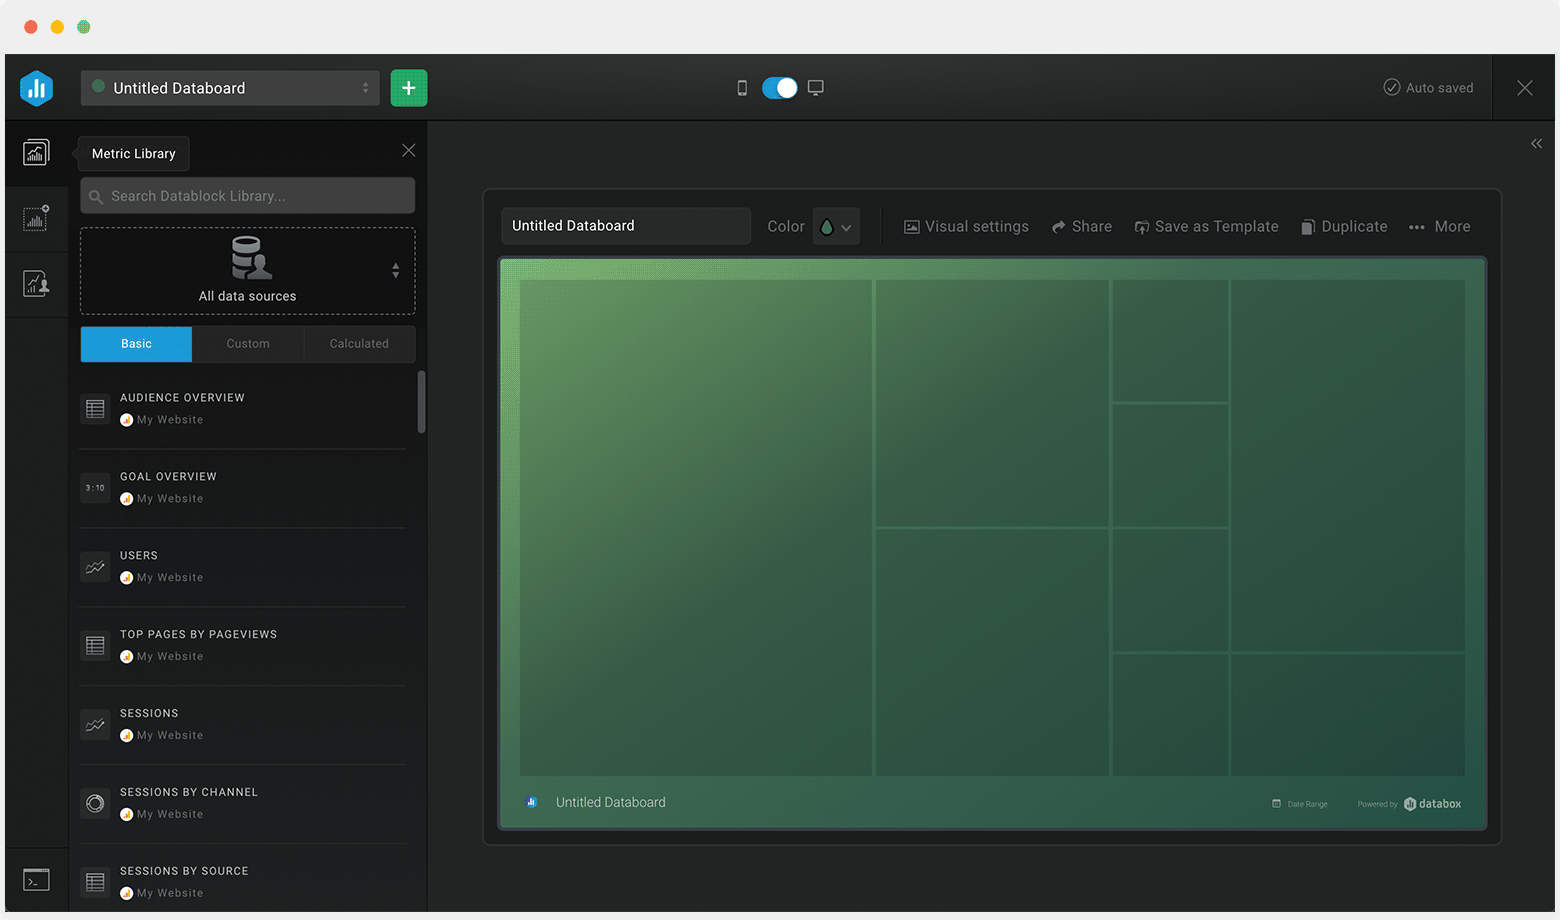
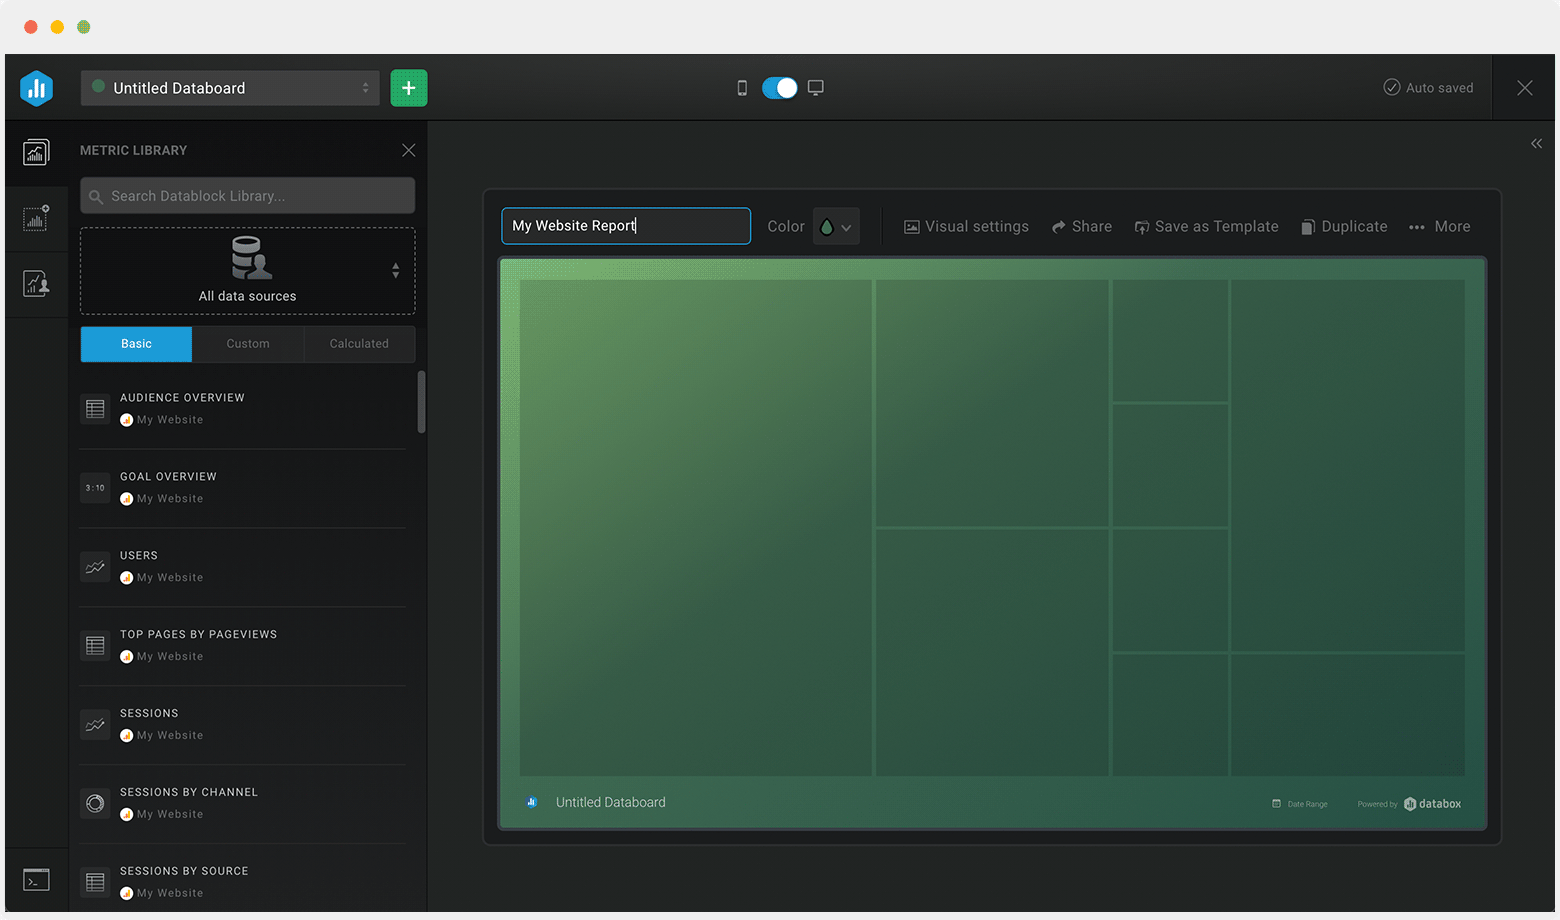
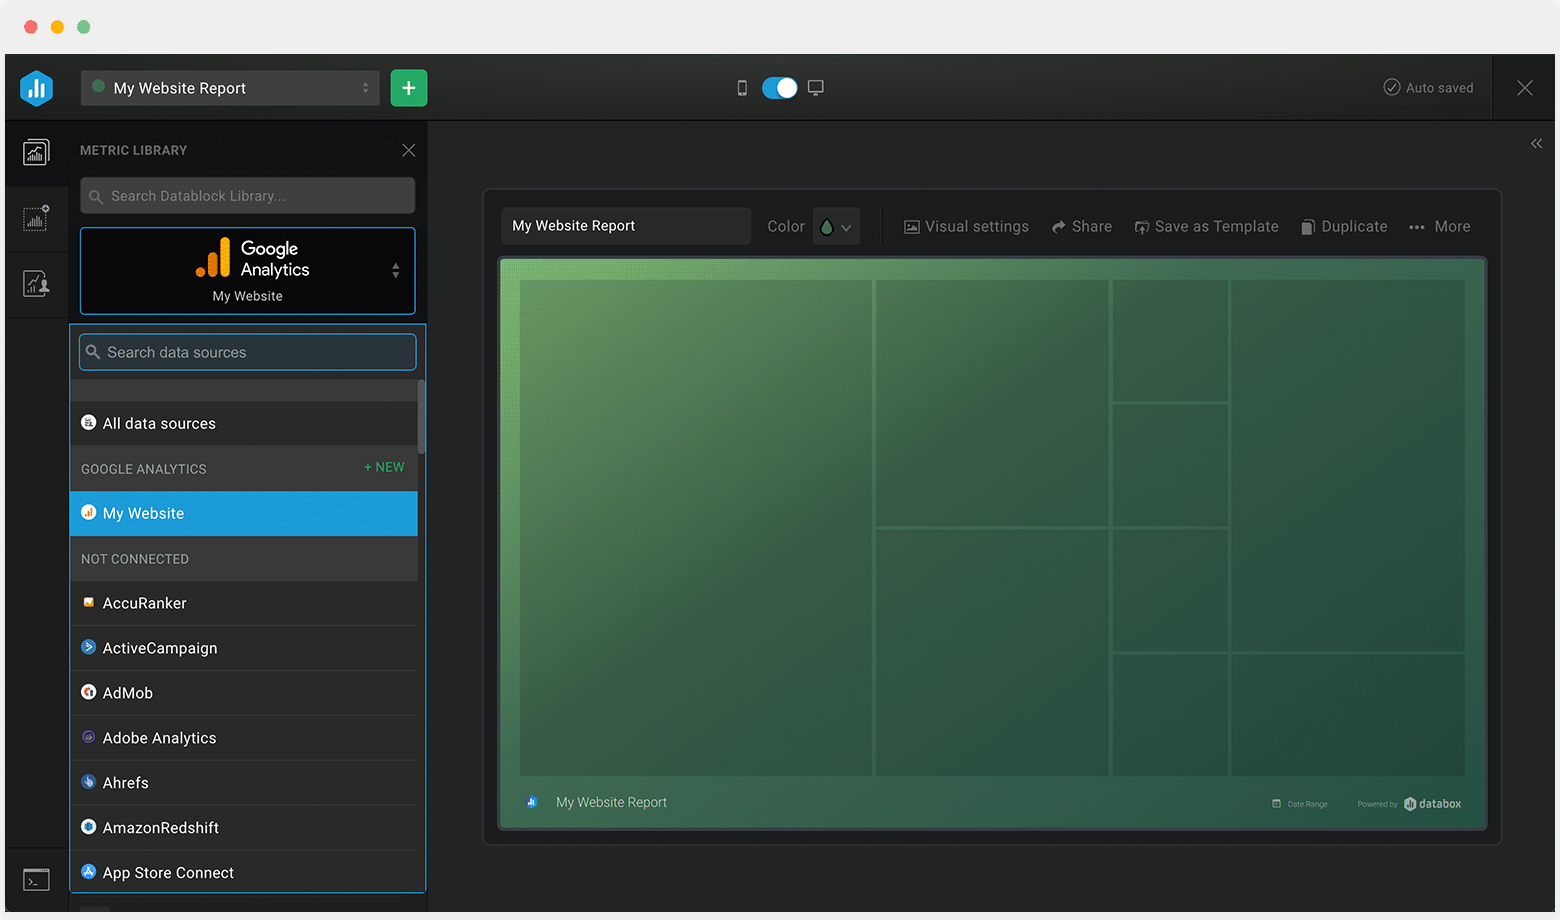
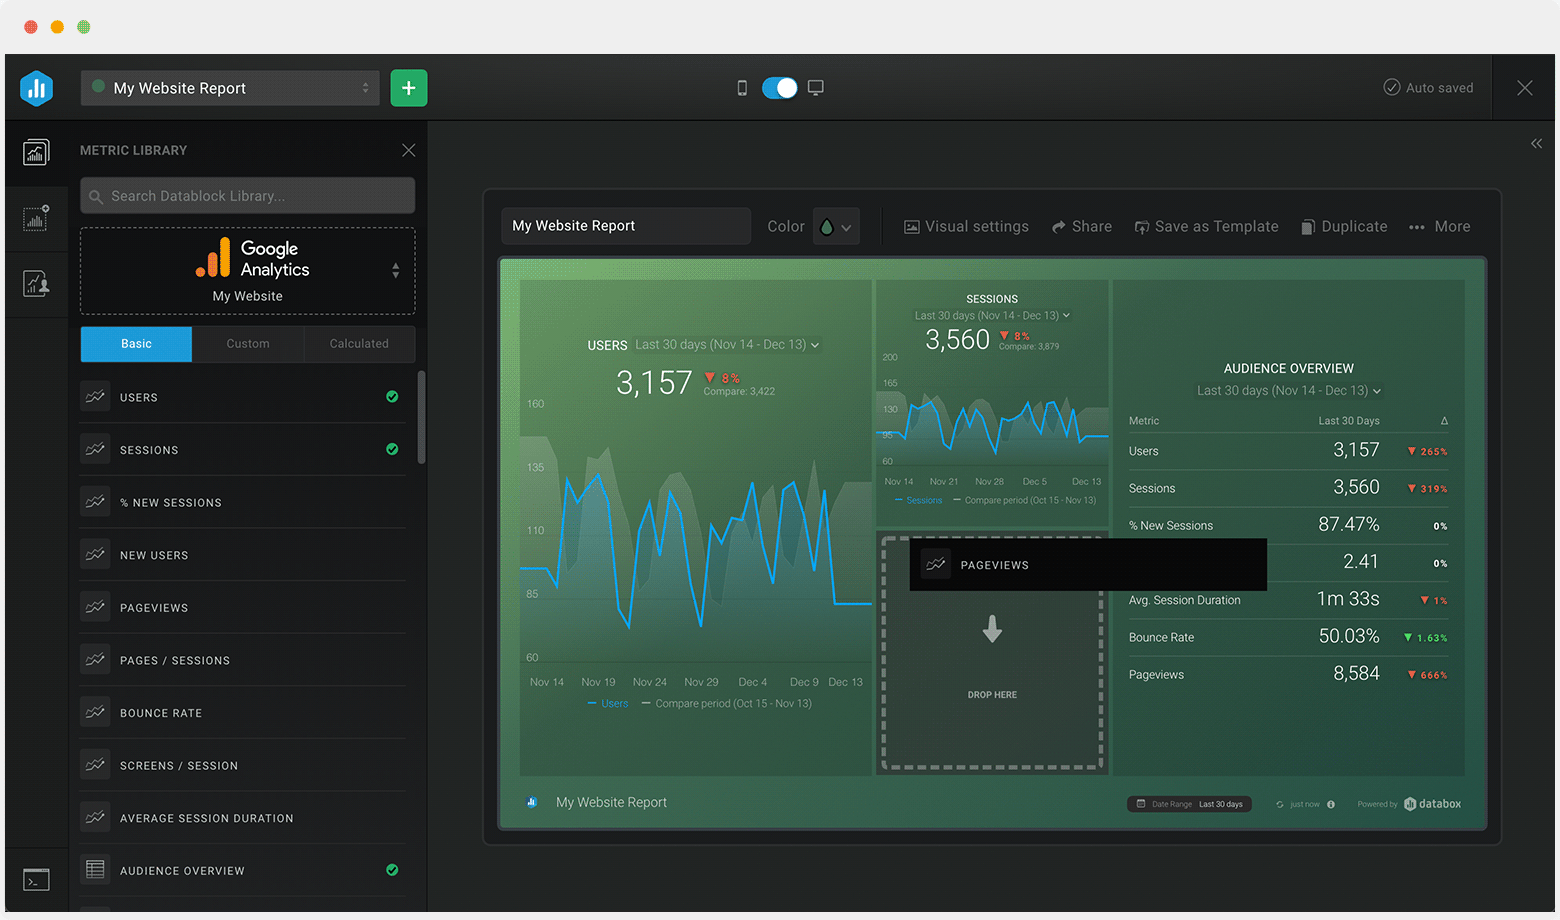
These sales events dashboards come pre-built with some of the most commonly tracked sales metrics from the most popular tools. You can also customize your templates later. To get started, just choose a template, connect your data, and your metric visualizations will populate automatically.
Try It Free


No design or coding skills necessary.
Learn more about Dashboard DesignerA sales events dashboard provides you with a complete overview of the most important KPIs and metrics related to your planned/executed event.
Use sales events dashboards to keep tabs of event goals, activities and sales targets in real-time, and to determine the effectiveness of your event marketing efforts and ROI.
When building a sales events dashboard, it is important to include the right event marketing and sales metrics and KPIs. This will in turn, allow you to quickly identify what’s working and what isn’t and how to improve your event sales strategy and performance over time.
The most important sales events metrics you should be tracking are:
