Uses one-click integrations:
-
 Salesforce CRM
If you don't use Salesforce CRM, you can pull data from any of our 130+ one-click, native integrations or from spreadsheets, databases and other APIs.
Try this dashboard for freeWhat you’ll learn from this Salesforce Leads Dashboard Template:
Connect your Salesforce account and learn:
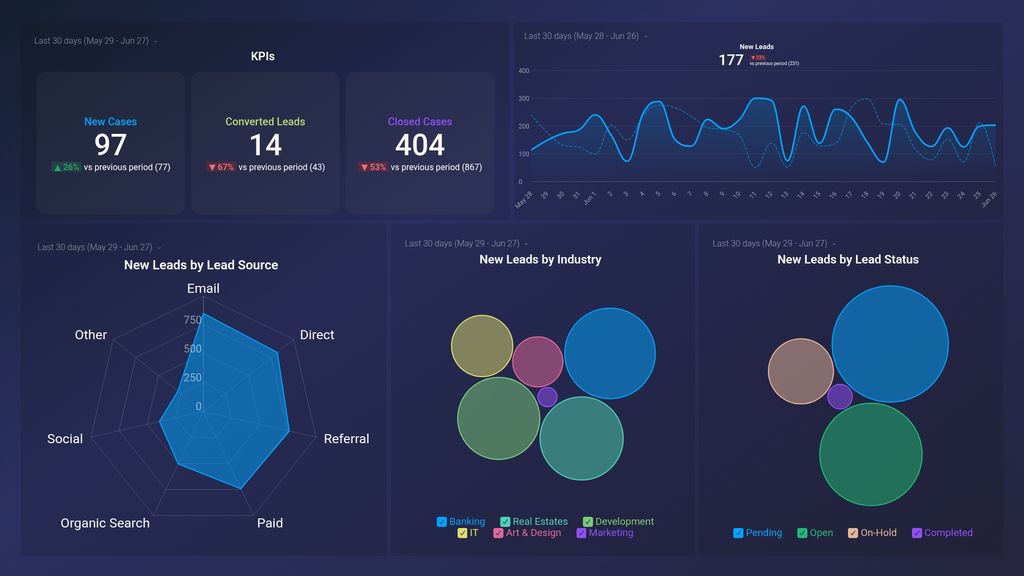
- Where do my leads come from? See which channels generate the most leads for your business and view the total number of leads generated from all of your marketing sources.
- How do I track my new and converted leads? Stay on top of your lead generation efforts by tracking how many new leads have been acquired via various sources.
- What stage are your leads in? See what stage of the sales pipeline your leads are in at any given point in time.
- How do I know who is managing a particular lead? See how many leads have been assigned to individual sales reps within a given timeframe.
Pull additional data using our deep integration with Salesforce.
What else can you track and visualize with our deep integration with Salesforce? When it comes to leads, sales & revenue, almost anything:
- Closed and won opportunities
- Win/loss rate
- Open activities (demos, calls, emails)
- Sales cycle
- Deal type
There are many, many different metrics and metric combinations you can track using Salesforce. And in Databox, you can quickly visualize dozens of salesforce metrics in a variety of different ways, alongside all the important metrics from other data sources you’re using.
Read more about Databox’s Salesforce integration.
Explore more Salesforce dashboards.
Salesforce CRM metrics included in this template
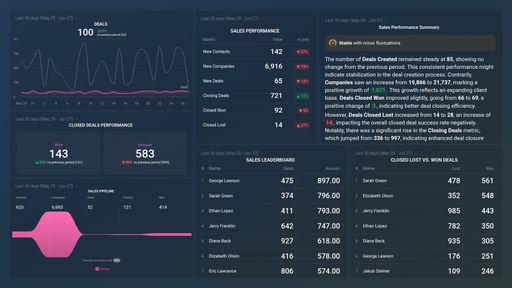
- New Leads
-
Closed Cases
Closed Cases measures the number of support cases that have been resolved and closed within a specific time period. It is an important metric to track customer satisfaction and support team performance.
-
New Cases
The New Cases metric measures the number of new customer inquiries or issues that have been submitted for resolution within a specific timeframe.
-
New Leads by Industry
The New Leads by Industry metric is a measure of the number of new potential customers or prospects generated by industry category within a specified time period.
-
New Leads by Lead Status
New Leads by Lead Status shows the number of leads that have been added in a given time period categorized by their status, such as open, qualified, or converted.